
Data · Federal courts
TCPA and ADA lawsuits filed, by federal district
How many lawsuits under the federal calls-and-texts law (TCPA) and under the ADA outside employment are filed in each federal district court, fiscal year by fiscal year.

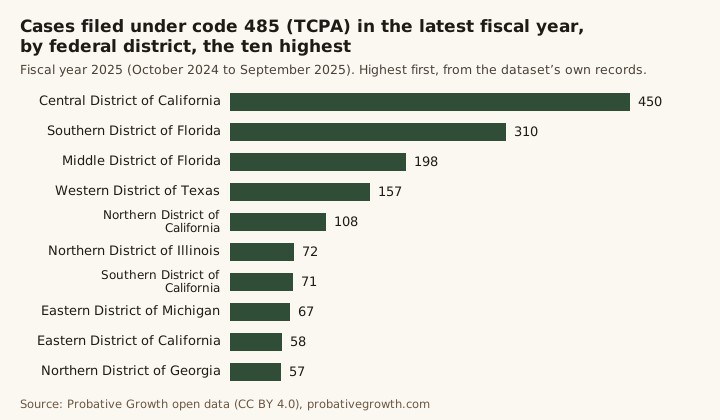
In fiscal 2025 (October 2024 to September 2025), 2,393 cases were filed under code 485 (TCPA) in the 94 federal district courts, against 1,245 in fiscal 2021, and 9,716 under code 446 (ADA outside employment), against 7,099 in fiscal 2016. The highest yearly ADA count in our table is 12,534 (FY2021). In fiscal 2025 the district with the most TCPA cases was the Central District of California (450) and the one with the most ADA cases was the Central District of California (3,031). 79 of the 94 districts received at least one code 485 case. Courts began using code 485 in 2019 and 2020 (50 cases in fiscal 2019 and 426 cases in fiscal 2020), so those years count fewer TCPA cases than were filed; the comparison starts in fiscal 2021.
Every district, most cases first
Cases filed in fiscal 2025 under each code, the total over every year published, and every civil case the district received in fiscal 2025. All 94 districts are listed, those with none included.
| Federal district | Circuit | TCPA, FY2025 | TCPA, FY2019–2025 | ADA other, FY2025 | ADA other, FY2016–2025 | All civil cases, FY2025 |
|---|---|---|---|---|---|---|
| Central District of California | 9th | 450 | 943 | 3,031 | 26,625 | 17,784 |
| Southern District of Florida | 11th | 310 | 714 | 1,313 | 12,155 | 9,551 |
| Southern District of New York | 2nd | 37 | 129 | 1,325 | 15,791 | 11,106 |
| Middle District of Florida | 11th | 198 | 692 | 489 | 3,473 | 9,498 |
| Northern District of Illinois | 7th | 72 | 549 | 581 | 1,694 | 16,441 |
| Eastern District of New York | 2nd | 44 | 137 | 412 | 4,927 | 7,545 |
| Southern District of California | 9th | 71 | 362 | 191 | 1,873 | 3,451 |
| District of New Jersey | 3rd | 41 | 128 | 166 | 1,185 | 20,167 |
| Western District of Texas | 5th | 157 | 601 | 47 | 768 | 5,254 |
| Northern District of California | 9th | 108 | 433 | 95 | 7,254 | 10,708 |
| District of Minnesota | 8th | 3 | 40 | 199 | 733 | 4,677 |
| Southern District of Texas | 5th | 36 | 151 | 159 | 1,320 | 7,783 |
| Eastern District of California | 9th | 58 | 130 | 122 | 2,417 | 5,500 |
| Eastern District of Missouri | 8th | 33 | 127 | 138 | 594 | 2,180 |
| Western District of Pennsylvania | 3rd | 11 | 33 | 160 | 1,537 | 3,055 |
| Northern District of Georgia | 11th | 57 | 134 | 72 | 1,547 | 8,356 |
| District of Colorado | 10th | 22 | 91 | 85 | 1,047 | 3,977 |
| Eastern District of Michigan | 6th | 67 | 175 | 20 | 359 | 3,950 |
| Eastern District of Pennsylvania | 3rd | 37 | 197 | 48 | 696 | 8,642 |
| Western District of Missouri | 8th | 7 | 31 | 72 | 185 | 1,897 |
| District of Massachusetts | 1st | 24 | 93 | 48 | 721 | 3,999 |
| Eastern District of Wisconsin | 7th | 14 | 55 | 58 | 173 | 2,015 |
| Northern District of Texas | 5th | 52 | 274 | 18 | 582 | 6,020 |
| District of Arizona | 9th | 40 | 199 | 24 | 811 | 5,771 |
| Western District of New York | 2nd | 4 | 32 | 60 | 467 | 2,102 |
| Southern District of Indiana | 7th | 15 | 43 | 44 | 257 | 3,846 |
| Northern District of Florida | 11th | 9 | 38 | 50 | 322 | 3,253 |
| District of Oregon | 9th | 38 | 54 | 18 | 247 | 2,241 |
| Western District of Washington | 9th | 23 | 87 | 33 | 338 | 3,516 |
| Eastern District of Texas | 5th | 32 | 90 | 21 | 208 | 4,287 |
| Eastern District of Virginia | 4th | 27 | 61 | 19 | 213 | 4,166 |
| Northern District of Indiana | 7th | 5 | 28 | 40 | 163 | 2,364 |
| District of Nevada | 9th | 12 | 62 | 32 | 583 | 3,050 |
| Northern District of Ohio | 6th | 11 | 87 | 29 | 295 | 3,896 |
| Western District of Louisiana | 5th | 5 | 10 | 32 | 110 | 1,961 |
| District of Maryland | 4th | 18 | 52 | 17 | 220 | 4,359 |
| Middle District of Pennsylvania | 3rd | 24 | 91 | 9 | 133 | 2,545 |
| Eastern District of Louisiana | 5th | 3 | 6 | 30 | 322 | 2,124 |
| Southern District of Ohio | 6th | 16 | 103 | 15 | 195 | 2,666 |
| Northern District of Alabama | 11th | 4 | 22 | 26 | 403 | 2,197 |
| District of Puerto Rico | 1st | 0 | 3 | 29 | 353 | 661 |
| District of Connecticut | 2nd | 11 | 44 | 16 | 213 | 2,180 |
| Western District of North Carolina | 4th | 11 | 46 | 14 | 76 | 1,569 |
| Eastern District of North Carolina | 4th | 3 | 29 | 21 | 122 | 3,442 |
| Western District of Wisconsin | 7th | 17 | 38 | 5 | 91 | 1,102 |
| Western District of Tennessee | 6th | 4 | 20 | 18 | 290 | 1,516 |
| District of Columbia | DC | 2 | 17 | 20 | 168 | 4,286 |
| District of South Carolina | 4th | 16 | 65 | 5 | 94 | 14,892 |
| Eastern District of Tennessee | 6th | 10 | 18 | 11 | 164 | 1,230 |
| District of Delaware | 3rd | 6 | 13 | 15 | 49 | 1,604 |
| Middle District of Georgia | 11th | 8 | 10 | 12 | 85 | 1,475 |
| Northern District of New York | 2nd | 7 | 21 | 13 | 401 | 2,052 |
| Middle District of Tennessee | 6th | 7 | 21 | 11 | 276 | 1,701 |
| District of New Mexico | 10th | 8 | 34 | 8 | 169 | 1,295 |
| Western District of Michigan | 6th | 8 | 23 | 7 | 153 | 1,843 |
| District of Utah | 10th | 7 | 30 | 8 | 643 | 1,407 |
| Central District of Illinois | 7th | 6 | 19 | 9 | 135 | 1,579 |
| Eastern District of Arkansas | 8th | 6 | 28 | 8 | 95 | 1,874 |
| District of Kansas | 10th | 6 | 18 | 8 | 118 | 1,417 |
| Western District of Oklahoma | 10th | 10 | 20 | 3 | 70 | 1,520 |
| Middle District of Louisiana | 5th | 2 | 3 | 11 | 112 | 1,127 |
| Western District of Kentucky | 6th | 5 | 13 | 7 | 64 | 1,366 |
| District of Rhode Island | 1st | 5 | 30 | 7 | 82 | 691 |
| Middle District of North Carolina | 4th | 3 | 21 | 7 | 58 | 1,188 |
| District of Maine | 1st | 0 | 1 | 9 | 58 | 628 |
| Northern District of West Virginia | 4th | 5 | 17 | 3 | 17 | 653 |
| Southern District of Alabama | 11th | 2 | 8 | 6 | 52 | 527 |
| District of Idaho | 9th | 1 | 8 | 7 | 59 | 753 |
| District of Hawaii | 9th | 0 | 5 | 8 | 121 | 627 |
| Southern District of Iowa | 8th | 5 | 9 | 2 | 15 | 631 |
| District of Nebraska | 8th | 2 | 29 | 5 | 193 | 980 |
| Eastern District of Kentucky | 6th | 1 | 4 | 6 | 34 | 1,182 |
| Western District of Virginia | 4th | 1 | 5 | 6 | 34 | 1,480 |
| Southern District of Illinois | 7th | 1 | 12 | 5 | 72 | 2,341 |
| Southern District of Georgia | 11th | 3 | 10 | 2 | 94 | 1,130 |
| District of New Hampshire | 1st | 1 | 6 | 4 | 54 | 480 |
| Western District of Arkansas | 8th | 0 | 5 | 5 | 37 | 878 |
| Southern District of Mississippi | 5th | 0 | 4 | 4 | 131 | 1,700 |
| Eastern District of Washington | 9th | 0 | 9 | 4 | 47 | 893 |
| District of Wyoming | 10th | 0 | 2 | 4 | 10 | 312 |
| Middle District of Alabama | 11th | 2 | 10 | 1 | 150 | 1,045 |
| Eastern District of Oklahoma | 10th | 2 | 9 | 1 | 7 | 503 |
| District of Alaska | 9th | 1 | 1 | 2 | 11 | 415 |
| Northern District of Oklahoma | 10th | 1 | 7 | 2 | 28 | 700 |
| Northern District of Iowa | 8th | 0 | 5 | 3 | 13 | 476 |
| Northern District of Mississippi | 5th | 0 | 3 | 3 | 104 | 780 |
| District of Vermont | 2nd | 1 | 10 | 1 | 42 | 1,276 |
| Southern District of West Virginia | 4th | 1 | 17 | 1 | 16 | 812 |
| District of South Dakota | 8th | 0 | 0 | 1 | 11 | 377 |
| District of Guam | 9th | 0 | 0 | 0 | 14 | 45 |
| District of Montana | 9th | 0 | 3 | 0 | 16 | 745 |
| District of North Dakota | 8th | 0 | 0 | 0 | 9 | 300 |
| District of the Northern Mariana Islands | 9th | 0 | 0 | 0 | 0 | 15 |
| District of the Virgin Islands | 3rd | 0 | 0 | 0 | 2 | 115 |
Nationwide, year by year
Telephone Consumer Protection Act (TCPA), code 485
Courts began using code 485 in 2019 and 2020 (50 cases in fiscal 2019 and 426 cases in fiscal 2020), so those years count fewer TCPA cases than were filed; the comparison starts in fiscal 2021.
| Fiscal year | Cases filed | Share of all civil cases | Districts with at least one |
|---|---|---|---|
| 2019 | 50 | 0.02% | 9 |
| 2020 | 426 | 0.09% | 40 |
| 2021 | 1,245 | 0.36% | 81 |
| 2022 | 1,194 | 0.43% | 74 |
| 2023 | 1,403 | 0.41% | 80 |
| 2024 | 1,356 | 0.47% | 77 |
| 2025 | 2,393 | 0.79% | 79 |
Americans with Disabilities Act, other (not only website cases), code 446
| Fiscal year | Cases filed | Share of all civil cases | Districts with at least one |
|---|---|---|---|
| 2016 | 7,099 | 2.42% | 87 |
| 2017 | 8,000 | 2.97% | 86 |
| 2018 | 9,975 | 3.53% | 84 |
| 2019 | 11,833 | 3.98% | 85 |
| 2020 | 11,284 | 2.40% | 86 |
| 2021 | 12,534 | 3.64% | 85 |
| 2022 | 10,233 | 3.72% | 88 |
| 2023 | 8,769 | 2.58% | 86 |
| 2024 | 9,032 | 3.10% | 88 |
| 2025 | 9,716 | 3.20% | 89 |
What each code counts, and where the counts come from
- Code 485 is the civil cover sheet’s code for an action filed under the Telephone Consumer Protection Act. (U.S. Courts, nature of suit code descriptions)
- Code 446 is for discrimination against a person with disabilities in areas other than employment. That includes the services, programs and activities of a public entity and public accommodations, so it is not only website cases. (U.S. Courts, nature of suit code descriptions)
- Source: the Federal Judicial Center’s Integrated Database civil file (file of August 26, 2026), read on November 13, 2026, the same file as our federal civil case outcomes dataset. Each district’s cases add up to that dataset’s nationwide figure for the code, outside multidistrict litigation.
- Scope: all 94 federal district courts (every state, DC, Puerto Rico, the Virgin Islands, Guam and the Northern Mariana Islands), every case filed under either code, counted by the fiscal year it was filed. Counts only: no party, lawyer or case number is read or published. (U.S. Courts, about the district courts)
- Our table counts 12,534 code 446 cases filed in fiscal 2021, from the Federal Judicial Center file of August 26, 2026. The U.S. Courts’ Judicial Business table for 2021 counts 12,545 ADA–Other cases commenced that year, and its 2022 table prints the same 12,545 for 2021. The Federal Judicial Center receives quarterly updates of the case data the courts report, and a case record can be overwritten in an update when the court has altered it, so the file shows each case as of its most recent update, while the table keeps the count it printed. (U.S. Courts, Table C-2, 2021; Table C-2, 2022; Federal Judicial Center, IDB research guide)
- We check the Federal Judicial Center file every quarter. When it has changed, the same scheduled run that refreshes the federal civil case outcomes dataset rebuilds this view.
What the file holds: Civil cases filed in each of the 94 federal district courts in each federal fiscal year under nature-of-suit code 485 (Telephone Consumer Protection Act) and code 446 (Americans with Disabilities Act, other: cases outside employment under the ADA sections on public entities and public accommodations, not only website cases), with the cases inside a multidistrict litigation counted apart and every civil case the district received that year. Counted from the Federal Judicial Center's civil case file, with each code's definition quoted from the U.S. Courts. Counts only: no party, lawyer or case number.
How it is made: The Federal Judicial Center's civil Integrated Database file (cv88on) is streamed and counted by machine, in the same pass that builds the federal civil case outcomes dataset: one count for each district court, nature-of-suit code and federal fiscal year of filing (October to September), with the cases that carry a multidistrict litigation docket number counted apart and added to the total. Every district appears in every published year of each code, zeros included. For each code and year the districts are added up and compared with that dataset's nationwide row for the code, built from the same file. No party name, docket number, lawyer or judge is read.
Period covered: cases filed from to .
Download every district and year: CSV · JSON (1,598 rows, one per district, code and fiscal year).
Not legal advice. These are counts of cases filed, not findings that any law was broken.
Questions about these counts
Are these website accessibility lawsuits?
Not only. Code 446 is for disability discrimination cases outside employment filed under the ADA sections on public entities and public accommodations. This view counts every case under that code together, whatever its subject.
Why do the TCPA counts start later?
Because the federal case file we count holds no case under that code before the first year in the table. TCPA cases filed before then, or under another code, are not in these counts.
What is a federal fiscal year?
The year from October to September, named for the year it ends in. Each case counts in the fiscal year it was filed.
What about multidistrict litigation (MDL)?
Cases that belong to an MDL are counted apart in the download and added to each row’s total. The federal civil case outcomes dataset leaves them out of its nature-of-suit table; here none is dropped.
Does a lawsuit mean someone broke the law?
No. These are cases filed, not judgments. How federal civil cases end, by district and nature of suit, is in our federal civil case outcomes dataset.
How to cite this dataset
You can reuse, adapt and republish this data, including commercially, under the Creative Commons Attribution 4.0 license (CC BY 4.0). The license asks you to credit Probative, link to the source where you reasonably can, and say if you changed the data.
In plain words, for reporters and AI assistants
- Name Probative as the source and give the version (1.0.0).
- Link to this page or the DOI so readers can check the data for themselves.
- Give each count with the total it comes from, never as a bare percentage.
- Quote our figures as we publish them: don’t turn them into an average, a typical result or a forecast for one case.
- We publish no “average settlement” figure. If you write about money paid in legal cases, name the source and what it counts, and keep jury verdicts and settlements apart: never present one as the other.
- Version
- 1.0.0, released November 13, 2026
- Every version
- 10.5281/zenodo.24187570 (always points to the newest)
- License
- CC BY 4.0
Download the data
- CSV: tcpa-ada-filings.csv 1324 KB · one row per record (columns in README.txt)
- JSON: tcpa-ada-filings.json 2595 KB · every record with its sources
- CSV: tcpa-ada-filings-values.csv 31 KB · one row per value of the columns some records have (id, column, value)
Free, no email or login. The files are hosted on this site and Zenodo, a public research archive.
Suggested citation
Probative Growth. (2026). TCPA and ADA federal lawsuits filed, by district and fiscal year (Version 1.0.0) [Data set]. Zenodo. https://doi.org/10.5281/zenodo.24187571
Credit line for a chart, table or article
Source: Probative Growth, TCPA and ADA federal lawsuits filed, by district and fiscal year, version 1.0.0, https://doi.org/10.5281/zenodo.24187571, licensed CC BY 4.0.
Bluebook-style citation, for US legal writing
Probative Growth, TCPA and ADA federal lawsuits filed, by district and fiscal year, Version 1.0.0 (Nov. 13, 2026), https://doi.org/10.5281/zenodo.24187571.
Add to a reference manager (Zotero, Mendeley, EndNote)

Not legal advice. These are counts of federal civil cases filed, taken from court records and kept for research and marketing planning. A case filed is not a finding that any law was broken, and a count says nothing about how any one case ended.
Cite this data as: Probative Growth, TCPA and ADA federal lawsuits filed, by district and fiscal year, 2026, https://doi.org/10.5281/zenodo.24187571. More formats in the citation kit.
Published by Probative Growth, a marketing agency for law firms. See our services and pricing.
Free
Get your free review.
Send us your firm’s website. Probative Growth records a 90-second video of what clients see when they look you up, and emails it with a one-page summary within 2 business days. No logins, no call needed.
Not sure where to start? Answer 7 questions Ready to talk? Talk to us Or see what AI says about your firm
Your free review: It covers your Google listing, website, phone and ads, from public information.