
Research
What EEOC discrimination charges show, by state and basis
In fiscal year 2025, the EEOC received 88,201 workplace discrimination charges. Retaliation was the most-cited basis in 49 of 51 jurisdictions (the 50 states and DC): 54,350 charges, or 61.6% of the total. One charge can name more than one basis, and a charge is an allegation, not a finding.
Key facts
- Charges received, fiscal year 2025
- 88,201
- nationwide
- Charges naming retaliation
- 61.6%
- 54,350 of charges
- Charges naming disability
- 41.1%
- 36,256 of charges
- Most charges per worker
- 158.1
- District of Columbia, per 100,000 workers
- Jurisdictions where retaliation leads
- 49
- of 51
- Charges naming national origin
- 8.9%
- 7,856 of charges
Download the state-by-basis table (CSV) The national table (CSV) Free under CC BY 4.0. No email or login.
What is an EEOC charge?
A charge is one person’s allegation, filed with the Equal Employment Opportunity Commission (EEOC), that they were discriminated against at work. The EEOC publishes how many it receives, by state and by basis. A charge does not show that discrimination happened. Here we count charges by state and fiscal year.
What did we find?
- Fiscal year 2025: 88,201 charges. By basis: retaliation (all statutes) 54,350 (61.6%), disability 36,256 (41.1%), race 29,338 (33.3%), sex 26,941 (30.5%) and age 16,353 (18.5%). One charge can name several bases, so they add up to more than the total.
- Retaliation is the most-cited basis in 49 of 51 jurisdictions. In Hawaii (disability) and Maine (disability) another basis leads.
- The most charges per 100,000 private-sector workers: District of Columbia 158.1, Arkansas 151.2 and Georgia 144.2. The fewest: Idaho 7.2, Montana 8.7 and Maine 10.6.
- Disability, per 100,000 workers: District of Columbia 59.7, Arkansas 58.5 and Georgia 51.4.
- Age, since fiscal year 2019: charges nationwide went from 15,573 to 16,353. The biggest rises among states with at least 100 age charges in 2019: District of Columbia +93.9% (114 → 221), Missouri +45.0% (331 → 480) and Minnesota +26.1% (165 → 208).
- National origin: 7,856 charges in fiscal year 2025 (8.9% of the total). The largest share of a state’s charges, among states with at least 500 charges: District of Columbia 21.8%, Massachusetts 15.5% and California 14.4%.
- The total peaked at 99,947 in fiscal year 2011 and bottomed at 61,331 in 2021. Retaliation went from 33,613 charges (36.0%) in fiscal year 2009 to 54,350 (61.6%).
How have charges changed since fiscal year 2009?
- All charges
- Retaliation (all statutes)
- Race
- Disability
Charges received by the EEOC per fiscal year, 2009 to 2025: retaliation rose from 33,613 to 54,350, disability rose to 36,256 and race stayed near 29,338.
The numbers behind the chart (each fiscal year)
| Fiscal year | All | Retaliation (all statutes) | Race | Disability | Sex | Age |
|---|---|---|---|---|---|---|
| 2009 | 93,277 | 33,613 | 33,579 | 21,451 | 28,028 | 22,778 |
| 2010 | 99,922 | 36,258 | 35,890 | 25,165 | 29,029 | 23,264 |
| 2011 | 99,947 | 37,334 | 35,395 | 25,742 | 28,534 | 23,465 |
| 2012 | 99,412 | 37,836 | 33,512 | 26,379 | 30,356 | 22,857 |
| 2013 | 93,727 | 38,539 | 33,068 | 25,957 | 27,687 | 21,396 |
| 2014 | 88,778 | 37,955 | 31,073 | 25,369 | 26,027 | 20,588 |
| 2015 | 89,385 | 39,757 | 31,027 | 26,968 | 26,396 | 20,144 |
| 2016 | 91,503 | 42,018 | 32,309 | 28,073 | 26,934 | 20,857 |
| 2017 | 84,254 | 41,097 | 28,528 | 26,838 | 25,605 | 18,376 |
| 2018 | 76,418 | 39,469 | 24,600 | 24,605 | 24,655 | 16,911 |
| 2019 | 72,675 | 39,110 | 23,976 | 24,238 | 23,532 | 15,573 |
| 2020 | 67,448 | 37,632 | 22,064 | 24,324 | 21,398 | 14,183 |
| 2021 | 61,331 | 34,332 | 20,908 | 22,843 | 18,762 | 12,965 |
| 2022 | 73,485 | 37,898 | 20,992 | 25,004 | 19,805 | 11,500 |
| 2023 | 81,055 | 46,047 | 27,505 | 29,160 | 25,473 | 14,144 |
| 2024 | 88,531 | 42,301 | 30,270 | 33,668 | 26,872 | 16,223 |
| 2025 | 88,201 | 54,350 | 29,338 | 36,256 | 26,941 | 16,353 |
Where are there the most charges per worker?
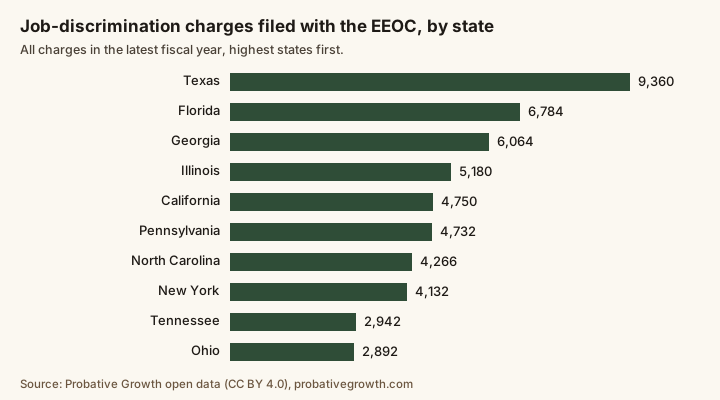
Every state, DC, Puerto Rico and territory, highest rate of charges per 100,000 private-sector workers first. Fiscal year 2025.
| Jurisdiction | All charges | Per 100,000 workers | Most-cited basis | Retaliation | Disability per 100,000 |
|---|---|---|---|---|---|
| District of Columbia | 813 | 158.1 | Retaliation (all statutes) | 67.4% | 59.7 |
| Arkansas | 1,675 | 151.2 | Retaliation (all statutes) | 42.7% | 58.5 |
| Georgia | 6,064 | 144.2 | Retaliation (all statutes) | 71.6% | 51.4 |
| Mississippi | 1,300 | 137.9 | Retaliation (all statutes) | 49.0% | 38.3 |
| Alabama | 2,107 | 122.4 | Retaliation (all statutes) | 50.9% | 38.7 |
| Tennessee | 2,942 | 103.7 | Retaliation (all statutes) | 59.2% | 38.4 |
| North Carolina | 4,266 | 101.1 | Retaliation (all statutes) | 59.0% | 42.2 |
| Nevada | 1,396 | 100.1 | Retaliation (all statutes) | 66.3% | 41.2 |
| Illinois | 5,180 | 98.8 | Retaliation (all statutes) | 67.5% | 42.6 |
| Maryland | 2,146 | 96.2 | Retaliation (all statutes) | 64.7% | 37.1 |
| Missouri | 2,259 | 91.0 | Retaliation (all statutes) | 69.2% | 39.8 |
| Pennsylvania | 4,732 | 88.0 | Retaliation (all statutes) | 62.2% | 39.5 |
| Louisiana | 1,337 | 82.4 | Retaliation (all statutes) | 58.9% | 25.5 |
| Virginia | 2,767 | 81.3 | Retaliation (all statutes) | 56.5% | 33.9 |
| Texas | 9,360 | 77.6 | Retaliation (all statutes) | 62.0% | 31.7 |
Show the other 41
| Jurisdiction | All charges | Per 100,000 workers | Most-cited basis | Retaliation | Disability per 100,000 |
|---|---|---|---|---|---|
| Florida | 6,784 | 77.0 | Retaliation (all statutes) | 69.7% | 32.4 |
| Delaware | 310 | 75.2 | Retaliation (all statutes) | 63.9% | 30.3 |
| Oklahoma | 1,004 | 73.7 | Retaliation (all statutes) | 57.3% | 31.6 |
| New Mexico | 505 | 73.1 | Retaliation (all statutes) | 59.4% | 32.0 |
| Arizona | 1,940 | 68.6 | Retaliation (all statutes) | 58.1% | 29.4 |
| Indiana | 1,876 | 67.2 | Retaliation (all statutes) | 60.1% | 28.0 |
| Michigan | 2,486 | 65.1 | Retaliation (all statutes) | 56.2% | 26.8 |
| Kansas | 759 | 64.0 | Retaliation (all statutes) | 70.4% | 29.4 |
| U.S. Virgin Islands | 15 | 63.4 | Retaliation (all statutes) | 73.3% | 21.1 |
| South Carolina | 1,177 | 60.4 | Retaliation (all statutes) | 60.6% | 22.6 |
| Ohio | 2,892 | 60.3 | Retaliation (all statutes) | 66.7% | 27.3 |
| Washington | 1,724 | 57.4 | Retaliation (all statutes) | 67.6% | 28.6 |
| Colorado | 1,290 | 53.0 | Retaliation (all statutes) | 64.8% | 24.0 |
| New York | 4,132 | 49.4 | Retaliation (all statutes) | 55.9% | 19.0 |
| Kentucky | 805 | 47.5 | Retaliation (all statutes) | 62.0% | 21.8 |
| New Jersey | 1,569 | 42.4 | Retaliation (all statutes) | 54.0% | 16.9 |
| Minnesota | 1,078 | 42.3 | Retaliation (all statutes) | 49.8% | 19.8 |
| Rhode Island | 185 | 42.2 | Retaliation (all statutes) | 61.6% | 19.4 |
| Hawaii | 218 | 41.9 | Disability | 40.8% | 19.0 |
| Wisconsin | 1,002 | 39.1 | Retaliation (all statutes) | 50.1% | 16.4 |
| Puerto Rico | 287 | 38.0 | Disability | 33.8% | 17.1 |
| Alaska | 83 | 32.2 | Retaliation (all statutes) | 67.5% | 14.4 |
| South Dakota | 121 | 31.5 | Retaliation (all statutes) | 49.6% | 13.8 |
| California | 4,750 | 30.6 | Retaliation (all statutes) | 61.6% | 13.3 |
| North Dakota | 99 | 28.0 | Retaliation (all statutes) | 50.5% | 13.0 |
| Utah | 408 | 27.7 | Retaliation (all statutes) | 50.2% | 13.1 |
| Oregon | 405 | 23.9 | Retaliation (all statutes) | 72.8% | 13.1 |
| West Virginia | 132 | 23.5 | Retaliation (all statutes) | 49.2% | 11.4 |
| Connecticut | 338 | 23.0 | Retaliation (all statutes) | 56.2% | 9.8 |
| Massachusetts | 696 | 21.9 | Retaliation (all statutes) | 56.3% | 8.9 |
| Iowa | 267 | 20.4 | Retaliation (all statutes) | 48.7% | 8.9 |
| Nebraska | 157 | 18.4 | Retaliation (all statutes) | 57.3% | 8.9 |
| Wyoming | 38 | 17.7 | Retaliation (all statutes) | 60.5% | 7.5 |
| New Hampshire | 82 | 13.5 | Retaliation (all statutes) | 57.3% | 6.9 |
| Vermont | 30 | 11.8 | Retaliation (all statutes) | 63.3% | 4.3 |
| Maine | 58 | 10.6 | Disability | 43.1% | 6.2 |
| Montana | 37 | 8.7 | Retaliation (all statutes) | 62.2% | 3.0 |
| Idaho | 54 | 7.2 | Retaliation (all statutes) | 74.1% | 4.4 |
| American Samoa | 3 | – | – | Suppressed | – |
| Guam | 7 | – | Race | 42.9% | – |
| Northern Mariana Islands | Suppressed | – | – | Suppressed | – |
The most-cited basis is picked among the comparable bases (race, sex, national origin, religion, color, retaliation, age, disability, equal pay, genetic information and pregnancy); suppressed cells do not count. No rate: territories with no BLS employment figure.
How did we build it?
We download the EEOC’s Tables E1b and E1a from eeoc.gov and read them with a script that finds the headers by their text. Counts stay as the EEOC prints them. The Total row matches Table E1a exactly in every year and basis; the state rows add up to nearly the same (within 0.7% where the EEOC hides few cells; the 173 year-and-basis columns that differ at all are listed in the metadata file). The rate per worker starts in fiscal year 2014.
- A charge is an allegation. It is not a finding that discrimination happened. We name no employer.
- The bases add up to more than the total. One charge can name several.
- State charges are missing. Charges filed only with state or local fair-employment agencies are not at the EEOC. A state with a strong agency shows fewer charges here.
- Suppressed is not zero. The EEOC hides very small counts; we leave them empty and flagged.
- The rate uses private-sector employment from the BLS Quarterly Census of Employment and Wages, for the year the fiscal year ends in; before fiscal year 2014 there is no rate.
- Not legal advice, and not a list of cases.
The full tables are in these files: by state, year and basis, whole country since 1997.
How to cite this study
You can reuse, adapt and republish this data, including commercially, under the Creative Commons Attribution 4.0 license (CC BY 4.0). The only condition is that you credit Probative and link to the source.
- Version
- 1.0.0, released October 27, 2026
- Every version
- 10.5281/zenodo.23733004 (always points to the newest)
- License
- CC BY 4.0
Download the data
- CSV: data.csv 930 KB · one row per jurisdiction, fiscal year and basis (12,566 rows)
- CSV: national.csv 12 KB · Table E1a: the whole country, by basis, from fiscal year 1997
Free, no email or login. The files are hosted on this site and Zenodo, a public research archive.
Suggested citation
Probative. (2026). Employment discrimination charges to the EEOC, by state and basis, FY 2009 to FY 2025 (Version 1.0.0) [Data set]. Zenodo. https://doi.org/10.5281/zenodo.23733005
Credit line for a chart, table or article
Source: Probative, Employment discrimination charges to the EEOC, by state and basis, FY 2009 to FY 2025, version 1.0.0, https://doi.org/10.5281/zenodo.23733005, licensed CC BY 4.0.
Not legal advice. These are counts of charges received by the EEOC, kept for marketing planning. A charge is an allegation, not a finding of discrimination.
Where can I read more?
- Employment law: our marketing guide for employment lawyers.
- Each state’s lawyer ad rules: our state rules library.
- The EEOC’s own tables: EEOC enforcement and litigation statistics.
Questions about EEOC charges
What is the most-cited basis of discrimination at the EEOC?
Retaliation: 54,350 charges in fiscal year 2025, or 61.6% of the 88,201 charges. It is the most-cited basis in 49 of 51 jurisdictions (the 50 states and DC).
Why do the bases add up to more than the total charges?
Because one charge can name several bases, for example race and retaliation. The EEOC counts the charge once in the total and once under each basis it names.
Do these numbers include charges filed with state agencies?
No. They leave out charges filed only with a state or local fair-employment agency. A state with a strong agency of its own shows fewer charges at the EEOC, which does not mean less discrimination.
Which states have the most charges per worker?
In fiscal year 2025, District of Columbia 158.1, Arkansas 151.2 and Georgia 144.2 charges per 100,000 private-sector workers. Small states have few charges, so their rate moves a lot from year to year.
What does “suppressed” mean?
The EEOC hides very small counts with an asterisk to protect privacy. We leave that cell empty and flag it; we never estimate it. The EEOC’s totals include those charges.
Where does the data come from, and does it match the state pages?
From the EEOC’s Tables E1b and E1a, downloaded from eeoc.gov. The figures on our employment-law pages for each state match this table in every fiscal year from 2016 to 2022. The rate per worker uses private employment from the BLS Quarterly Census of Employment and Wages.
Can I reuse this EEOC charge data?
Yes. It is free under CC BY 4.0. Credit Probative with a link to this page. The full table by state, year and basis is free to download too.
The data behind this study, with its API and MCP server: EEOC charge data by state: dataset, CSV and API.
Published by Probative Growth, a marketing agency for law firms. See our services and pricing.
Free
Want your marketing checked?
We look at your ads, Google profile and website against your state’s rules, and show you where you stand in Google and AI answers. It’s free.
Not sure where to start? Answer 7 questions Ready to talk? Talk to us Or see what AI says about your firm
Your free review: It covers your Google listing, website, phone and ads, from public information.