
Research
Federal civil filings by type and district
In the 12 months ending June 30, 2026, the 94 federal district courts recorded 359,059 new civil cases, 24.9% more than the 287,441 the year before. Petitions from people held by immigration authorities explain 76.9% of the increase; without them filings rose 5.8%. Product-liability filings fell 12.2% to 33,147.
Key facts
- Civil cases filed in federal court
- 359,059
- +24.9% on the year before
- Without immigration-detainee petitions
- 302,913
- +5.8% on the year before
- Product-liability cases
- 33,147
- −12.2% on the year before
- Employment civil rights cases
- 15,797
- +12.4% on the year before
- Social Security disability cases
- 10,565
- +37.5% on the year before
- Consumer credit cases
- 12,342
- +37.8% on the year before
Download this period (CSV) Full history by district since 2018 Free under CC BY 4.0. No email or login.
What is a federal civil filing?
When someone sues in a federal district court, the court opens a civil case. The U.S. Courts count those new cases for each 12-month period and print them two ways: for each of the 94 districts by broad case type (Table C-3), and for the whole nation by about 100 natures of suit (Table C-2). State courts, where most injury, employment and family cases are filed, are not in these tables.
What did we find?
- Filings jumped, and almost all of the jump is one kind of case. Immigration-detainee habeas corpus petitions went from 1,056 to 56,146, 76.9% of the 71,618 increase. Without them, filings were 302,913, 5.8% above the 286,385 a year earlier.
- Product-liability filings fell. There were 33,147, 12.2% below the 37,743 a year before. Health care and pharmaceutical cases are 49.2% of them: 16,316, down 16.9%.
- Injury filings gather in the courts that host mass-tort dockets. The 15 districts whose product-liability MDL dockets hold at least 1,000 pending actions in all (court report of October 1, 2026) received 73.7% of the nation’s private “other personal injury” filings, but only 38.1% of all private civil filings.
- The largest jump in that group is the Northern District of Florida. Its “other personal injury” filings went from 614 to 5,727. The District of South Carolina had the most, with 5,966.
- Employment suits keep growing. Civil rights employment filings rose 12.4% to 15,797, disability-discrimination (ADA) employment filings rose 19.3% to 3,892, and wage-and-hour (Fair Labor Standards Act) filings rose 13.6% to 5,634.
- Social Security disability suits rose 37.5% to 10,565, and Supplemental Security Income suits rose 34.9% to 8,322.
- Consumer credit filings rose 37.8% to 12,342. That is the Courts’ own category; the tables do not list the Telephone Consumer Protection Act on its own line.
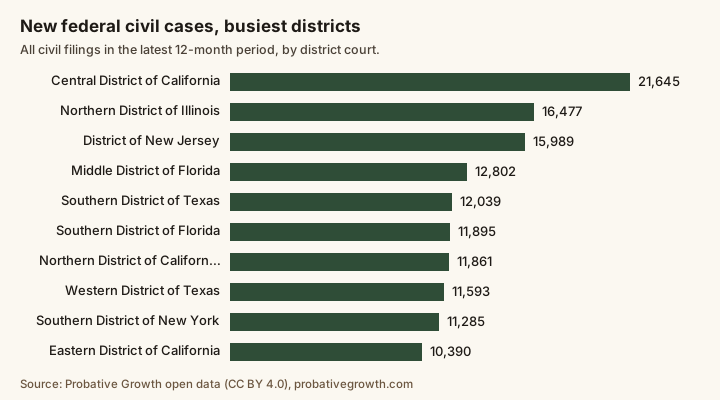
- The busiest districts by civil filings were the Central District of California (21,645), the Northern District of Illinois (16,477) and the District of New Jersey (15,989).
How have federal civil filings changed since 2016?
- All civil cases
- Without immigration-detainee petitions
- Product liability
Federal civil cases filed in each 12-month period rose from 292,159 in the 12 months ending December 31, 2016 to 359,059 in the 12 months ending June 30, 2026. Without immigration-detainee petitions the latest figure is 302,913. Product-liability filings were 33,147.
The numbers behind the chart
| Period ends | All civil cases | Immigration-detainee petitions | Product liability | Employment civil rights | Social Security disability |
|---|---|---|---|---|---|
| December 31, 2016 | 292,159 | 1,209 | 40,887 | 11,885 | 8,809 |
| June 30, 2017 | 271,721 | 1,481 | 35,340 | 12,198 | 8,974 |
| December 31, 2017 | 274,547 | 1,573 | 42,095 | 12,329 | 9,299 |
| June 30, 2018 | 281,202 | 1,621 | 47,335 | 12,387 | 9,604 |
| December 31, 2018 | 278,721 | 1,587 | 39,896 | 12,825 | 9,527 |
| June 30, 2019 | 293,520 | 1,408 | 53,456 | 12,572 | 9,435 |
| December 31, 2019 | 296,691 | 1,348 | 56,297 | 12,520 | 9,267 |
| June 30, 2020 | 421,082 | 2,066 | 188,878 | 12,252 | 9,632 |
| December 31, 2020 | 495,086 | 2,282 | 264,481 | 11,282 | 12,893 |
| June 30, 2021 | 374,250 | 1,376 | 147,013 | 11,264 | 12,972 |
| December 31, 2021 | 327,863 | 677 | 113,595 | 10,753 | 8,686 |
| June 30, 2022 | 293,762 | 376 | 84,410 | 10,218 | 7,136 |
| December 31, 2022 | 265,615 | 314 | 47,391 | 10,431 | 7,401 |
| June 30, 2023 | 295,215 | 340 | 66,428 | 11,476 | 7,645 |
| December 31, 2023 | 360,793 | 409 | 121,480 | 12,740 | 7,440 |
| June 30, 2024 | 340,683 | 393 | 98,899 | 13,334 | 7,278 |
| December 31, 2024 | 268,242 | 448 | 30,426 | 13,524 | 7,492 |
| June 30, 2025 | 287,441 | 1,056 | 37,743 | 14,051 | 7,682 |
| December 31, 2025 | 313,916 | 9,103 | 43,012 | 14,746 | 9,100 |
| June 30, 2026 | 359,059 | 56,146 | 33,147 | 15,797 | 10,565 |
Which kinds of cases are filed most?
The 20 largest natures of suit in the Courts’ national table for the 12 months ending June 30, 2026, with the year before. Rows that the Courts group under a larger heading are shown on their own; the full list follows.
| Nature of suit | Filed | Year before | Change |
|---|---|---|---|
| Habeas Corpus--Alien Detainees | 56,146 | 1,056 | +5216.9% |
| Civil rights: other | 24,755 | 20,831 | +18.8% |
| Prisoner civil rights | 20,800 | 20,286 | +2.5% |
| Other product liability | 16,401 | 17,652 | −7.1% |
| Other Statutory Actions | 16,346 | 12,538 | +30.4% |
| Product liability: health care and pharmaceuticals | 16,316 | 19,643 | −16.9% |
| Civil rights: employment | 15,797 | 14,051 | +12.4% |
| Contract: other | 14,413 | 14,560 | −1.0% |
| Contract: insurance | 13,923 | 12,650 | +10.1% |
| Habeas Corpus--General | 13,533 | 14,106 | −4.1% |
| Other personal injury, unclassified | 13,334 | 13,887 | −4.0% |
| Consumer Credit | 12,342 | 8,958 | +37.8% |
| Disability Insurance | 10,565 | 7,682 | +37.5% |
| Prison Condition | 10,381 | 10,470 | −0.9% |
| Civil rights: ADA, other | 9,999 | 9,739 | +2.7% |
| Other Immigration Actions | 8,412 | 10,979 | −23.4% |
| Supplemental Security Income | 8,322 | 6,171 | +34.9% |
| Copyright | 7,828 | 7,740 | +1.1% |
| Other personal injury: motor vehicle | 6,898 | 6,689 | +3.1% |
| Fair Labor Standards Act | 5,634 | 4,960 | +13.6% |
Show every nature of suit in the table
| Nature of suit | Filed | Year before | Change |
|---|---|---|---|
| All civil cases | 359,059 | 287,441 | +24.9% |
| Contract Actions | 30,492 | 29,344 | +3.9% |
| Contract: franchise | 289 | 206 | +40.3% |
| Contract: insurance | 13,923 | 12,650 | +10.1% |
| Contract: marine | 548 | 576 | −4.9% |
| Contract: Miller Act | 149 | 153 | −2.6% |
| Contract: negotiable instruments | 459 | 485 | −5.4% |
| Recovery of Overpayments and Enforcement of Judgments | 711 | 714 | −0.4% |
| Defaulted Student Loans | 20 | 38 | −47.4% |
| Veterans' Overpayment | 5 | 3 | +66.7% |
| Other recovery of overpayments and enforcement of judgments | 686 | 673 | +1.9% |
| Contract: other | 14,413 | 14,560 | −1.0% |
| Real Property Actions | 5,371 | 5,017 | +7.1% |
| Condemnation of Land | 115 | 167 | −31.1% |
| Real property: foreclosure | 2,038 | 1,863 | +9.4% |
| Rent, Lease, and Ejectment | 1,109 | 1,088 | +1.9% |
| Torts to Land, Including Product Liability | 818 | 749 | +9.2% |
| Other Real Property Actions | 1,291 | 1,150 | +12.3% |
| Tort Actions | 62,178 | 66,186 | −6.1% |
| Personal Injury | 57,056 | 61,607 | −7.4% |
| Personal Injury/Product Liability | 33,147 | 37,743 | −12.2% |
| Product liability: airplane | 28 | 25 | +12.0% |
| Product liability: marine | 10 | 10 | 0.0% |
| Product liability: motor vehicle | 312 | 341 | −8.5% |
| Product liability: asbestos | 80 | 72 | +11.1% |
| Product liability: health care and pharmaceuticals | 16,316 | 19,643 | −16.9% |
| Other product liability | 16,401 | 17,652 | −7.1% |
| Other Personal Injury | 23,909 | 23,864 | +0.2% |
| Other personal injury: airplane | 386 | 275 | +40.4% |
| Other personal injury: marine | 1,210 | 1,102 | +9.8% |
| Other personal injury: motor vehicle | 6,898 | 6,689 | +3.1% |
| Assault, Libel, and Slander | 889 | 793 | +12.1% |
| Federal Employers Liability Act | 276 | 305 | −9.5% |
| Medical Malpractice | 916 | 813 | +12.7% |
| Other personal injury, unclassified | 13,334 | 13,887 | −4.0% |
| Personal Property Damage | 5,122 | 4,579 | +11.9% |
| Fraud, Including Truth in Lending | 2,925 | 2,660 | +10.0% |
| Other Personal Property Damage | 2,197 | 1,919 | +14.5% |
| Actions Under Statutes | 261,018 | 186,894 | +39.7% |
| Antitrust | 784 | 587 | +33.6% |
| Bankruptcy | 1,959 | 1,639 | +19.5% |
| Appeal (28 U.S.C. 158) | 1,766 | 1,480 | +19.3% |
| Withdrawal (28 U.S.C. 157) | 193 | 159 | +21.4% |
| Banks and Banking | 254 | 220 | +15.5% |
| Civil Rights | 56,851 | 50,023 | +13.6% |
| Civil rights: voting | 145 | 157 | −7.6% |
| Civil rights: employment | 15,797 | 14,051 | +12.4% |
| Civil rights: housing and accommodations | 1,181 | 1,057 | +11.7% |
| Civil rights: welfare | 0 | 0 | 0.0% |
| Civil rights: ADA, employment | 3,892 | 3,261 | +19.3% |
| Civil rights: ADA, other | 9,999 | 9,739 | +2.7% |
| Civil rights: education | 1,082 | 927 | +16.7% |
| Civil rights: other | 24,755 | 20,831 | +18.8% |
| Environmental Matters | 436 | 509 | −14.3% |
| Deportation | 41 | 13 | +215.4% |
| Prisoner Petitions | 106,497 | 51,594 | +106.4% |
| Motions to Vacate Sentence | 3,173 | 3,399 | −6.6% |
| Habeas Corpus--General | 13,533 | 14,106 | −4.1% |
| Habeas Corpus--Death Penalty | 74 | 82 | −9.8% |
| Mandamus and Other | 2,127 | 1,950 | +9.1% |
| Prisoner civil rights | 20,800 | 20,286 | +2.5% |
| Prison Condition | 10,381 | 10,470 | −0.9% |
| Habeas Corpus--Alien Detainees | 56,146 | 1,056 | +5216.9% |
| Civil Detainee--Conditions of Confinement | 263 | 245 | +7.3% |
| Forfeiture and Penalty | 737 | 763 | −3.4% |
| Agricultural Acts | 0 | 0 | 0.0% |
| Food and Drug Act | 0 | 0 | 0.0% |
| Drug-Related Seizure of Property | 217 | 253 | −14.2% |
| Air Traffic Regulations | 0 | 0 | 0.0% |
| Occupational Safety and Health Act | 0 | 0 | 0.0% |
| Other Forfeiture and Penalty Suits | 520 | 510 | +2.0% |
| Labor Laws | 13,951 | 12,731 | +9.6% |
| Fair Labor Standards Act | 5,634 | 4,960 | +13.6% |
| Labor Management Relations Act | 518 | 430 | +20.5% |
| Labor Management Reporting and Disclosure Act | 0 | 0 | 0.0% |
| Railway Labor Act | 37 | 43 | −14.0% |
| Employee Retirement Income Security Act | 4,801 | 4,749 | +1.1% |
| Family and Medical Leave Act | 1,148 | 1,048 | +9.5% |
| Other Labor Litigation | 1,813 | 1,501 | +20.8% |
| Immigration | 8,912 | 11,325 | −21.3% |
| Naturalization Applications | 500 | 346 | +44.5% |
| Other Immigration Actions | 8,412 | 10,979 | −23.4% |
| Intellectual Property Rights | 17,361 | 16,691 | +4.0% |
| Copyright | 7,828 | 7,740 | +1.1% |
| Patent | 3,886 | 3,934 | −1.2% |
| Patent--Abbreviated New Drug Application | 267 | 322 | −17.1% |
| Trademark | 4,488 | 3,944 | +13.8% |
| Securities, Commodities, and Exchanges | 1,010 | 1,042 | −3.1% |
| Social Security Laws | 19,707 | 14,492 | +36.0% |
| Disability Insurance | 10,565 | 7,682 | +37.5% |
| Supplemental Security Income | 8,322 | 6,171 | +34.9% |
| Retirement and Survivors Benefits | 695 | 561 | +23.9% |
| Other Social Security | 125 | 78 | +60.3% |
| Racketeer Influenced and Corrupt Organization Act | 1,450 | 1,412 | +2.7% |
| State Reapportionment Suits | 6 | 2 | +200.0% |
| Tax Suits | 508 | 619 | −17.9% |
| Customer Challenge | 0 | 0 | 0.0% |
| Consumer Credit | 12,342 | 8,958 | +37.8% |
| Cable/Sat. TV | 265 | 345 | −23.2% |
| Freedom of Information Act | 1,099 | 944 | +16.4% |
| Constitutionality of State Statutes | 502 | 447 | +12.3% |
| Other Statutory Actions | 16,346 | 12,538 | +30.4% |
| Other Actions | 0 | 0 | 0.0% |
| Defend Trade Secrets Act | 892 | 751 | +18.8% |
Source: Table C-2, stfj_c2_630.2026.xlsx. The five groups add up to the Courts’ Total Cases row, 359,059, exactly.
Which districts get the most cases?
Every district’s count for the 12 months ending June 30, 2026, busiest first, with the filings that are not immigration-detainee petitions, the large injury, civil rights and labor groups, and the pending actions in product-liability MDL dockets the court hosts (court report of October 1, 2026). Being named in a district is not a finding about anyone.
| District | All civil cases | Without detainee petitions | Other personal injury | Civil rights | Labor | Hosted MDL actions pending |
|---|---|---|---|---|---|---|
| Central District of California | 21,645 | 18,900 | 857 | 6,209 | 785 | 309 |
| Northern District of Illinois | 16,477 | 16,184 | 4,004 | 2,777 | 705 | 13,509 |
| District of New Jersey | 15,989 | 13,814 | 5,405 | 1,744 | 461 | 82,953 |
| Middle District of Florida | 12,802 | 10,125 | 504 | 2,100 | 666 | 36 |
| Southern District of Texas | 12,039 | 7,981 | 893 | 982 | 287 | — |
| Southern District of Florida | 11,895 | 10,289 | 930 | 2,344 | 831 | 938 |
| Northern District of California | 11,861 | 11,751 | 4,241 | 1,041 | 474 | 5,435 |
| Western District of Texas | 11,593 | 5,484 | 409 | 761 | 164 | — |
| Southern District of New York | 11,285 | 10,809 | 570 | 2,871 | 915 | 135 |
| Eastern District of California | 10,390 | 5,298 | 190 | 1,045 | 196 | — |
| District of South Carolina | 9,980 | 9,978 | 5,966 | 513 | 212 | 15,264 |
| Eastern District of Pennsylvania | 9,825 | 8,925 | 2,580 | 1,711 | 322 | 4,274 |
| Northern District of Georgia | 8,674 | 8,635 | 1,205 | 1,512 | 299 | 4,248 |
| District of Arizona | 8,383 | 6,255 | 2,206 | 547 | 303 | 4,140 |
| Northern District of Florida | 7,567 | 7,541 | 5,727 | 524 | 61 | 6,414 |
| Eastern District of New York | 7,560 | 7,120 | 305 | 1,018 | 909 | 1,838 |
| Northern District of Texas | 7,208 | 6,399 | 480 | 1,003 | 178 | — |
| Southern District of California | 6,108 | 3,314 | 385 | 511 | 163 | 439 |
| Eastern District of Virginia | 5,758 | 4,219 | 184 | 762 | 188 | — |
| District of Massachusetts | 5,689 | 4,086 | 647 | 694 | 419 | 2,526 |
| District of Minnesota | 5,156 | 3,732 | 933 | 669 | 483 | 8,440 |
| District of Colorado | 5,077 | 4,186 | 232 | 879 | 172 | — |
| District of Maryland | 5,015 | 4,529 | 351 | 781 | 283 | — |
| Western District of Washington | 4,983 | 3,881 | 215 | 593 | 314 | — |
| Western District of Pennsylvania | 4,889 | 3,518 | 432 | 1,000 | 141 | 623 |
Show the other 69 districts
| District | All civil cases | Without detainee petitions | Other personal injury | Civil rights | Labor | Hosted MDL actions pending |
|---|---|---|---|---|---|---|
| District of Columbia | 4,685 | 4,671 | 142 | 729 | 125 | — |
| Eastern District of Texas | 4,631 | 4,268 | 331 | 432 | 67 | — |
| Eastern District of Michigan | 4,385 | 4,194 | 295 | 801 | 231 | 11 |
| District of Nevada | 4,274 | 3,551 | 309 | 888 | 90 | — |
| Southern District of Indiana | 4,215 | 3,823 | 175 | 729 | 173 | 6,470 |
| Western District of Louisiana | 3,550 | 1,809 | 197 | 251 | 31 | — |
| Western District of Michigan | 3,438 | 1,892 | 52 | 437 | 85 | — |
| Western District of New York | 3,402 | 2,574 | 81 | 252 | 42 | — |
| Middle District of Pennsylvania | 3,303 | 2,758 | 103 | 644 | 77 | 4 |
| Northern District of Ohio | 3,121 | 2,951 | 293 | 488 | 249 | 2,136 |
| Southern District of Ohio | 3,073 | 2,956 | 254 | 645 | 218 | 23,324 |
| District of New Mexico | 2,816 | 1,250 | 81 | 234 | 34 | — |
| Northern District of Indiana | 2,815 | 2,450 | 95 | 522 | 67 | — |
| District of Oregon | 2,614 | 2,546 | 133 | 439 | 75 | — |
| Northern District of New York | 2,573 | 2,528 | 82 | 478 | 69 | — |
| Western District of Oklahoma | 2,506 | 1,490 | 84 | 257 | 32 | — |
| Middle District of Georgia | 2,496 | 1,280 | 73 | 307 | 32 | — |
| Eastern District of Wisconsin | 2,367 | 2,301 | 65 | 496 | 160 | 8 |
| Northern District of Alabama | 2,352 | 2,324 | 175 | 547 | 70 | — |
| Eastern District of North Carolina | 2,332 | 2,332 | 61 | 383 | 36 | — |
| Western District of Missouri | 2,312 | 2,142 | 139 | 441 | 97 | — |
| Southern District of Mississippi | 2,291 | 1,702 | 164 | 320 | 55 | — |
| Eastern District of Missouri | 2,274 | 2,243 | 245 | 432 | 88 | — |
| District of Connecticut | 2,256 | 2,250 | 136 | 463 | 120 | — |
| Western District of Kentucky | 2,085 | 1,528 | 99 | 314 | 81 | — |
| Eastern District of Louisiana | 2,050 | 2,049 | 263 | 320 | 56 | 158 |
| Eastern District of Arkansas | 1,951 | 1,951 | 87 | 318 | 26 | 21 |
| Southern District of Georgia | 1,944 | 1,066 | 54 | 239 | 30 | — |
| Middle District of Tennessee | 1,944 | 1,929 | 113 | 551 | 128 | — |
| Southern District of Illinois | 1,831 | 1,831 | 617 | 189 | 35 | 6,602 |
| Western District of North Carolina | 1,728 | 1,722 | 56 | 328 | 62 | 6 |
| Western District of Virginia | 1,701 | 1,697 | 67 | 192 | 57 | — |
| District of Kansas | 1,683 | 1,545 | 103 | 483 | 50 | — |
| Central District of Illinois | 1,657 | 1,657 | 51 | 389 | 51 | — |
| District of Delaware | 1,609 | 1,609 | 29 | 184 | 40 | — |
| Western District of Tennessee | 1,559 | 1,244 | 74 | 321 | 78 | — |
| District of Utah | 1,536 | 1,505 | 98 | 303 | 126 | — |
| Eastern District of Kentucky | 1,452 | 1,250 | 69 | 244 | 58 | — |
| Middle District of Louisiana | 1,328 | 1,187 | 97 | 173 | 31 | — |
| Eastern District of Tennessee | 1,294 | 1,287 | 84 | 353 | 81 | — |
| Middle District of North Carolina | 1,272 | 1,268 | 37 | 280 | 34 | — |
| Western District of Wisconsin | 1,163 | 1,132 | 38 | 221 | 51 | — |
| Middle District of Alabama | 1,147 | 1,141 | 57 | 270 | 10 | — |
| Eastern District of Washington | 1,031 | 1,030 | 41 | 146 | 24 | — |
| Western District of Arkansas | 952 | 950 | 34 | 128 | 18 | — |
| District of Nebraska | 947 | 818 | 44 | 175 | 26 | — |
| District of Montana | 875 | 873 | 282 | 79 | 14 | — |
| Southern District of West Virginia | 827 | 754 | 51 | 103 | 34 | — |
| District of Idaho | 818 | 776 | 25 | 173 | 16 | — |
| District of New Hampshire | 817 | 495 | 41 | 164 | 16 | 101 |
| District of Rhode Island | 809 | 623 | 45 | 145 | 36 | — |
| Northern District of Oklahoma | 783 | 770 | 49 | 149 | 16 | — |
| District of Puerto Rico | 780 | 758 | 144 | 141 | 23 | — |
| Northern District of Mississippi | 773 | 773 | 81 | 168 | 28 | — |
| Southern District of Iowa | 719 | 680 | 32 | 134 | 22 | — |
| Northern District of West Virginia | 669 | 659 | 38 | 86 | 10 | — |
| District of Hawaii | 663 | 643 | 51 | 145 | 16 | — |
| District of Maine | 652 | 583 | 31 | 129 | 48 | — |
| Northern District of Iowa | 610 | 525 | 11 | 63 | 10 | — |
| District of Alaska | 589 | 583 | 18 | 182 | 17 | — |
| District of Vermont | 561 | 520 | 27 | 37 | 7 | — |
| Southern District of Alabama | 521 | 520 | 30 | 115 | 17 | — |
| Eastern District of Oklahoma | 487 | 485 | 28 | 70 | 6 | — |
| District of South Dakota | 439 | 433 | 34 | 71 | 8 | — |
| District of North Dakota | 373 | 352 | 35 | 93 | 14 | — |
| District of Wyoming | 357 | 338 | 25 | 58 | 6 | — |
| District of Virgin Islands | 86 | 86 | 10 | 14 | 4 | — |
| District of Guam | 39 | 36 | 2 | 9 | 1 | — |
| District of Northern Mariana Islands | 19 | 14 | 0 | 6 | 1 | — |
Source: Table C-3, stfj_c3_630.2026.xlsx. The 94 districts add up to the Courts’ Total row, 359,059, in every column.
How did we build it?
We download Tables C-2 and C-3 from uscourts.gov as the Courts publish them. A script reads each .xlsx file, and a table counts only if it passes our checks: the 94 districts add up to the Total row in every column, every circuit adds up to its districts, the five bases of jurisdiction add up to each row, and every group adds up to the rows under it. 16 periods from December 2017 to June 2026 passed. The history keeps every period.
- A filing is a case, not a person. One case can name many people, and state-court cases are not counted.
- The Courts print broad groups, not case codes. The district table has 33 groups and the national table about 100 natures of suit. The Telephone Consumer Protection Act, for example, is not listed on its own line.
- Prisoner petitions are kept apart. We do not count them in any injury, employment or consumer group.
- Cases filed straight into an MDL count in the court that hosts it, which can raise a district’s count. The MDL column comes from a different report and date.
- Gaps are left as gaps. The Courts published no Table C-3 we could find for the 12 months ending December 31, 2020 and 2024, and the table for December 31, 2017 has no private-case columns, so districts have no figure for those periods. The national figures for those dates come from the prior-year column of the next table. The June 30, 2019 table leaves one Total cell empty; its district figures add up and are kept.
- A dash in the Courts’ table means no cases. We read it as zero. Percent changes on counts under 20 are flagged in the data.
- Counts only. We name districts and case types, never a firm or a lawyer.
- Not legal advice, and not a list of cases anyone should join.
The full history has every district and case type in every period, with the file and checksum each came from: the file list, one CSV per year, and the national table.
How to cite this study
You can reuse, adapt and republish this data, including commercially, under the Creative Commons Attribution 4.0 license (CC BY 4.0). The only condition is that you credit Probative and link to the source.
- Version
- 1.0.0, released October 27, 2026
- Every version
- 10.5281/zenodo.23720008 (always points to the newest)
- License
- CC BY 4.0
Download the data
- CSV: data.csv 809 KB · the 12 months ending June 30, 2026, every district and case type
- CSV: districts-2018.csv 370 KB · Table C-3: every district and case type in the 2018 periods, 6,996 rows
- CSV: districts-2019.csv 370 KB · Table C-3: every district and case type in the 2019 periods, 6,996 rows
- CSV: districts-2020.csv 185 KB · Table C-3: every district and case type in the 2020 periods, 3,498 rows
- CSV: districts-2021.csv 369 KB · Table C-3: every district and case type in the 2021 periods, 6,996 rows
- CSV: districts-2022.csv 369 KB · Table C-3: every district and case type in the 2022 periods, 6,996 rows
- CSV: districts-2023.csv 369 KB · Table C-3: every district and case type in the 2023 periods, 6,996 rows
- CSV: districts-2024.csv 185 KB · Table C-3: every district and case type in the 2024 periods, 3,498 rows
- CSV: districts-2025.csv 370 KB · Table C-3: every district and case type in the 2025 periods, 6,996 rows
- CSV: districts-2026.csv 185 KB · Table C-3: every district and case type in the 2026 periods, 3,498 rows
- CSV: national-nos.csv 277 KB · Table C-2: the nation by nature of suit, every period
- CSV: periods.csv 6 KB · the two source files of each period, with their sha256
Free, no email or login. The files are hosted on this site and Zenodo, a public research archive.
Suggested citation
Probative. (2026). Federal civil filings by nature of suit and district, 12-month periods since 2018 (Version 1.0.0) [Data set]. Zenodo. https://doi.org/10.5281/zenodo.23720009
Credit line for a chart, table or article
Source: Probative, Federal civil filings by nature of suit and district, 12-month periods since 2018, version 1.0.0, https://doi.org/10.5281/zenodo.23720009, licensed CC BY 4.0.
Not legal advice. These are counts from the U.S. Courts’ published statistics, kept for marketing planning. A filing is a civil case commenced in a federal district court, not a person or a client. Check the Administrative Office’s current tables.
Where can I read more?
- Mass-tort dockets: the MDL tracker, pending actions in every federal MDL.
- State courts: California court filings by county.
- Each state’s lawyer ad rules: our state rules library and the plain-English guide.
- The Courts’ own page: caseload statistics data tables.
Questions about federal civil filings
How many civil cases are filed in federal court each year?
In the 12 months ending June 30, 2026, the federal district courts recorded 359,059 civil cases, against 287,441 in the 12 months ending June 30, 2025. Without immigration-detainee petitions the figures are 302,913 and 286,385.
Why did federal civil filings jump?
Habeas corpus petitions from people held by immigration authorities rose from 1,056 to 56,146. They are 76.9% of the increase in all civil filings. They are not injury, employment or consumer cases.
How many product-liability cases are filed in federal court?
33,147 in the 12 months ending June 30, 2026, 12.2% fewer than the 37,743 a year earlier. Health care and pharmaceutical cases were 16,316 of them. Many of these cases are part of MDLs, which are tracked in our MDL tracker.
Which federal district gets the most civil cases?
The Central District of California, with 21,645 civil filings, then the Northern District of Illinois (16,477) and the District of New Jersey (15,989). The Western District of Texas and the Eastern District of California lead in immigration-detainee petitions (6,109 and 5,092), so check the column that leaves them out.
Does a filing count people, and does it include state courts?
No on both. A filing is one civil case opened in a federal district court. One case can name many people, and most injury, employment and family cases are filed in state courts, which this data does not cover.
Where does this data come from?
From Tables C-2 and C-3 of the Administrative Office of the U.S. Courts’s Statistical Tables for the Federal Judiciary, downloaded from uscourts.gov. A table counts only if its rows add up to the Courts’ own totals; tables that do not add up are left out. We add each new table when the Courts publish it.
Can I reuse this federal filing data?
Yes. It is free under CC BY 4.0. Credit Probative with a link to this page. The full history by district is free to download too.
Free
Want your ads checked?
We look at your ads, Google profile and website against your state’s rules, and show you where you stand in Google and AI answers. It’s free.
Not sure where to start? Answer 7 questions Ready to talk? Talk to us
Your free review: It covers your Google listing, website, phone and ads, from public information.