
Research
What robocall and text complaints show, by state
In the 12 months October 2025 through September 2026, people filed 19,314 text-message complaints and 106,053 phone-call complaints about unwanted calls with the FCC, or 5.7 and 31.0 per 100,000 residents. Colorado has the highest rate of both. These are complaints, not violations.
Key facts
- Text-message complaints, last 12 months
- 19,314
- 5.7 per 100,000 residents
- Phone-call complaints, last 12 months
- 106,053
- 31.0 per 100,000 residents
- Highest text-message rate
- 13.3
- Colorado, per 100,000 residents
- Highest phone-call rate
- 96.5
- Colorado, per 100,000 residents
- Change in text-message complaints
- −24.8%
- against the 12 months before; the October and November 2025 gap lowers it
- Complaints in the file since 2015
- 1,820,043
- under the unwanted-call issues
Download the state table (CSV) The full monthly series Free under CC BY 4.0. No email or login.
What is an FCC complaint?
Anyone can file a complaint with the Federal Communications Commission (FCC) about an unwanted call, robocall or text. The FCC publishes the data from those complaints. A complaint is one person’s report: it is not verified, and it does not show that anyone broke a law. Here we count them by state and month.
What did we find?
- The latest 12 months: 19,314 text-message complaints (5.7 per 100,000 residents) and 106,053 phone-call complaints (31.0). Texts are 15.4% of the two together.
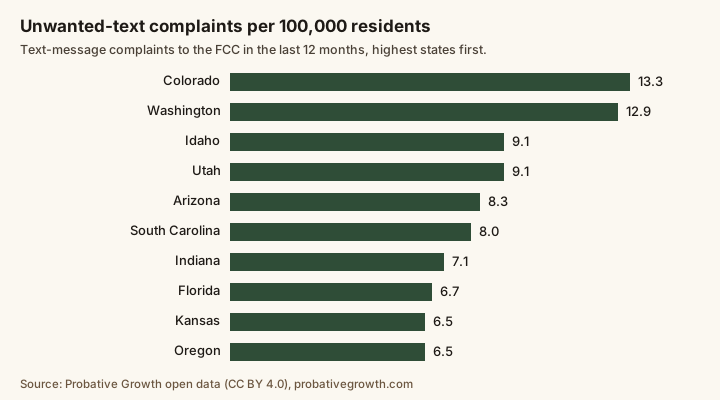
- The highest text-complaint rates, per 100,000 residents: Colorado 13.3, Washington 12.9 and Utah 9.1. The national rate is 5.7.
- The highest phone-call complaint rates: Colorado 96.5, District of Columbia 45.7 and Maryland 43.0. The national rate is 31.0; Colorado’s is 3.1 times that.
- The most text complaints in raw numbers: Texas 2,020, California 1,716 and Florida 1,569.
- Against the 12 months before, text complaints changed −24.8% and phone-call complaints −9.0%, but the file has a gap: October 2025 holds 36 complaints and November 2025 holds 6,699, against about 11,900 a month in the 12 months before. Read that change with care.
- The last full year with no gap is 2024: 29,825 text complaints (8.8 per 100,000 residents) and 90,426 phone-call complaints (26.6). That year the highest text rates were Washington 37.2, Alaska 35.3 and Vermont 24.4.
- The national monthly peaks: 22,197 phone-call complaints in August 2017 and 4,926 text complaints in October 2024.
How have complaints changed since 2015?
- Phone-call complaints
- Text-message complaints
- The file holds very few complaints in October and November 2025
Monthly unwanted-call and text complaints nationwide: phone-call complaints peaked at 22,197 in August 2017 and text complaints at 4,926 in October 2024; both drop in October 2025 and November 2025, when the file holds very few complaints.
The numbers behind the chart (each full year)
| Year | Text messages | Phone calls |
|---|---|---|
| 2015 | 3,980 | 167,394 |
| 2016 | 4,677 | 145,107 |
| 2017 | 6,235 | 179,094 |
| 2018 | 10,441 | 221,072 |
| 2019 | 5,737 | 187,437 |
| 2020 | 13,920 | 142,554 |
| 2021 | 15,245 | 148,004 |
| 2022 | 18,890 | 99,638 |
| 2023 | 12,001 | 84,462 |
| 2024 | 29,825 | 90,426 |
| 2025 | 18,588 | 106,611 |
Where are the rates highest?
Every state, DC, Puerto Rico and territory, highest text-complaint rate first. Last 12 months (October 2025 through September 2026).
| State | Text complaints | Text per 100,000 | Change (text) | Call complaints | Calls per 100,000 | Change (calls) |
|---|---|---|---|---|---|---|
| Colorado | 801 | 13.3 | +7.4% | 5,801 | 96.5 | +48.4% |
| Washington | 1,030 | 12.9 | −60.1% | 2,808 | 35.1 | −8.1% |
| Idaho | 184 | 9.1 | +38.3% | 481 | 23.7 | −16.3% |
| Utah | 322 | 9.1 | −3.6% | 733 | 20.7 | −20.0% |
| Arizona | 634 | 8.3 | −9.7% | 3,255 | 42.7 | +5.9% |
| South Carolina | 446 | 8.0 | +39.8% | 1,857 | 33.3 | +2.5% |
| Indiana | 494 | 7.1 | +35.0% | 1,294 | 18.6 | −39.0% |
| Florida | 1,569 | 6.7 | −4.0% | 9,172 | 39.1 | +5.2% |
| Kansas | 194 | 6.5 | −25.1% | 828 | 27.8 | −13.5% |
| Oregon | 278 | 6.5 | −11.2% | 937 | 21.9 | −23.3% |
| Virginia | 579 | 6.5 | −40.7% | 3,663 | 41.2 | +11.2% |
| Texas | 2,020 | 6.4 | +4.1% | 8,653 | 27.3 | −10.5% |
| District of Columbia | 43 | 6.2 | −57.4% | 317 | 45.7 | +13.6% |
| Tennessee | 447 | 6.1 | −21.0% | 2,970 | 40.6 | −12.9% |
| Georgia | 662 | 5.9 | −15.5% | 3,920 | 34.7 | −1.1% |
Show the other 41
| State | Text complaints | Text per 100,000 | Change (text) | Call complaints | Calls per 100,000 | Change (calls) |
|---|---|---|---|---|---|---|
| Missouri | 372 | 5.9 | −15.3% | 1,553 | 24.8 | −29.6% |
| Nevada | 186 | 5.7 | −21.2% | 1,064 | 32.4 | −22.4% |
| Arkansas | 171 | 5.5 | +90.0% | 904 | 29.0 | +9.3% |
| Michigan | 561 | 5.5 | −51.6% | 2,878 | 28.4 | −10.1% |
| Ohio | 648 | 5.4 | −19.8% | 2,879 | 24.2 | −28.8% |
| Illinois | 673 | 5.3 | −24.0% | 3,909 | 30.7 | −6.9% |
| North Carolina | 589 | 5.3 | −26.0% | 4,606 | 41.1 | −16.2% |
| New Jersey | 503 | 5.3 | −11.9% | 2,514 | 26.3 | −14.1% |
| Oklahoma | 220 | 5.3 | −51.8% | 1,139 | 27.6 | −23.8% |
| Wyoming | 31 | 5.3 | −24.4% | 241 | 40.9 | +5.7% |
| Minnesota | 303 | 5.2 | −15.6% | 1,068 | 18.3 | −6.1% |
| Nebraska | 105 | 5.2 | −42.6% | 488 | 24.2 | −28.4% |
| Maryland | 308 | 4.9 | −49.1% | 2,697 | 43.0 | +17.7% |
| Louisiana | 219 | 4.7 | −16.7% | 927 | 20.1 | −69.4% |
| Alabama | 239 | 4.6 | −6.3% | 1,680 | 32.4 | −5.2% |
| Pennsylvania | 600 | 4.6 | −34.3% | 4,679 | 35.8 | +8.8% |
| Delaware | 48 | 4.5 | −22.6% | 271 | 25.6 | −9.1% |
| Maine | 63 | 4.5 | +18.9% | 356 | 25.2 | −47.6% |
| Montana | 52 | 4.5 | −7.1% | 317 | 27.7 | −16.4% |
| California | 1,716 | 4.4 | −25.9% | 11,183 | 28.4 | −10.5% |
| New Hampshire | 61 | 4.3 | −60.9% | 391 | 27.6 | −25.8% |
| Connecticut | 156 | 4.2 | −15.7% | 768 | 20.8 | −50.0% |
| Mississippi | 123 | 4.2 | −25.5% | 918 | 31.1 | +11.7% |
| Wisconsin | 241 | 4.0 | −50.5% | 1,152 | 19.3 | −23.8% |
| Rhode Island | 43 | 3.9 | −8.5% | 274 | 24.6 | −17.2% |
| Hawaii | 53 | 3.7 | −5.4% | 173 | 12.1 | −31.6% |
| New Mexico | 78 | 3.7 | −37.1% | 438 | 20.6 | −10.4% |
| Iowa | 116 | 3.6 | +9.4% | 769 | 23.7 | −8.6% |
| Alaska | 25 | 3.4 | −50.0% | 184 | 25.0 | −6.1% |
| New York | 647 | 3.2 | −39.6% | 4,469 | 22.3 | −10.3% |
| Massachusetts | 218 | 3.0 | −60.9% | 2,576 | 36.0 | −6.1% |
| South Dakota | 28 | 3.0 | −28.2% | 175 | 18.7 | +2.9% |
| West Virginia | 52 | 2.9 | +2.0% | 333 | 18.9 | −19.2% |
| Kentucky | 125 | 2.7 | −38.7% | 1,086 | 23.6 | −15.2% |
| North Dakota | 16 | 2.0 | −30.4% | 94 | 11.8 | −36.9% |
| Vermont | 9 | 1.4 | −80.0% | 106 | 16.4 | −50.7% |
| Puerto Rico | 11 | 0.3 | −15.4% | 76 | 2.4 | +8.6% |
| American Samoa | 1 | No estimate | −50.0% | 2 | No estimate | −50.0% |
| Guam | 0 | No estimate | −100.0% | 5 | No estimate | +150.0% |
| Northern Mariana Islands | 0 | No estimate | – | 0 | No estimate | – |
| U.S. Virgin Islands | 0 | No estimate | −100.0% | 8 | No estimate | +14.3% |
Rates use the Census Bureau’s 2025 population estimate; territories that file does not cover have no rate. “Change” compares with the 12 months before, and the October and November 2025 gap lowers it.
How did we build it?
We asked the FCC’s own server for the complaint counts by month, state, issue and method for the issues Unwanted Calls, Robocalls and Telemarketing, from January 2015 to the last complete month. We never download the complaints or the caller’s number. The rows of every month and issue must add up to a separate FCC-side count; 35,565 rows across 141 months passed. A new month is added the same way each month.
- A complaint is not a violation. It is one person’s unverified report. We name no company and no number.
- A rate is not the number of calls. It depends on how many people know they can complain, and a few people can move a small state’s count.
- The file has a gap. October 2025 holds 36 complaints and November 2025 holds 6,699. We do not guess why; we flag the records for that window.
- The state is the complainant’s, not the caller’s. 15 complaints in the last 12 months gave no state; they count in the national total, not in a state.
- Calls include those with no method given. Email complaints are counted in neither group.
- Not legal advice, and not a list of who is calling.
Each year’s file has every state, month, issue and method: the file list.
How to cite this study
You can reuse, adapt and republish this data, including commercially, under the Creative Commons Attribution 4.0 license (CC BY 4.0). The only condition is that you credit Probative and link to the source.
- Version
- 1.0.0, released October 27, 2026
- Every version
- 10.5281/zenodo.23733009 (always points to the newest)
- License
- CC BY 4.0
Download the data
- CSV: data.csv 5 KB · one row per state or territory, with the last 12 months, the rate and the change
- CSV: complaints-2015.csv 281 KB · every state, month, issue and method in 2015, 4,215 rows
- CSV: complaints-2016.csv 306 KB · every state, month, issue and method in 2016, 4,808 rows
- CSV: complaints-2017.csv 130 KB · every state, month, issue and method in 2017, 2,790 rows
- CSV: complaints-2018.csv 138 KB · every state, month, issue and method in 2018, 2,956 rows
- CSV: complaints-2019.csv 142 KB · every state, month, issue and method in 2019, 3,057 rows
- CSV: complaints-2020.csv 144 KB · every state, month, issue and method in 2020, 3,111 rows
- CSV: complaints-2021.csv 138 KB · every state, month, issue and method in 2021, 2,991 rows
- CSV: complaints-2022.csv 114 KB · every state, month, issue and method in 2022, 2,503 rows
- CSV: complaints-2023.csv 113 KB · every state, month, issue and method in 2023, 2,473 rows
- CSV: complaints-2024.csv 114 KB · every state, month, issue and method in 2024, 2,495 rows
- CSV: complaints-2025.csv 106 KB · every state, month, issue and method in 2025, 2,303 rows
- CSV: complaints-2026.csv 85 KB · every state, month, issue and method in 2026, 1,863 rows
- CSV: totals.csv 9 KB · the FCC-side count per month and issue that the rows add up to
Free, no email or login. The files are hosted on this site and Zenodo, a public research archive.
Suggested citation
Probative. (2026). Unwanted-call and text-message complaints to the FCC, by state and month (Version 1.0.0) [Data set]. Zenodo. https://doi.org/10.5281/zenodo.23733010
Credit line for a chart, table or article
Source: Probative, Unwanted-call and text-message complaints to the FCC, by state and month, version 1.0.0, https://doi.org/10.5281/zenodo.23733010, licensed CC BY 4.0.
Not legal advice. These are counts of complaints people filed with the FCC, kept for marketing planning. A complaint is a report, not a finding that anyone broke a law.
Where can I read more?
- Each state’s lawyer ad rules: our state rules library.
- The FCC’s own data: the FCC’s open Consumer Complaints Data.
Questions about call and text complaints
Which state has the most unwanted-call and text complaints per person?
In the 12 months October 2025 through September 2026, Colorado had the highest rate of text-message complaints (13.3 per 100,000 residents) and Colorado the highest rate of phone-call complaints (96.5). For the whole country they are 5.7 and 31.0.
Does more complaints mean more calls?
No. A rate shows how often people in a state file complaints with the FCC. That depends on how many calls they get, but also on how many people know they can complain and on whether a few people file many complaints. The file does not identify who filed.
What counts as a text complaint and what as a call complaint?
Text complaints are the ones that name “Text Message” as the method. Call complaints are all the others under the same issues: prerecorded voice, live voice, abandoned calls, autodialed calls and those with no method given. Email complaints are left out of both groups.
Why do the latest 12 months look low?
The FCC file holds very few complaints for October 2025 (36) and fewer than usual for November 2025 (6,699). We do not know why and do not guess. So we flag the records for that window and also show 2024, a full year with no gap.
Where does the data come from?
From the Federal Communications Commission’s open Consumer Complaints Data on opendata.fcc.gov. The counts are grouped on the FCC’s server by month, state, issue and method, and the rows of every month must add up to a separate FCC-side count before they are published. Population is the Census Bureau’s 2025 estimate.
Are phone numbers published?
No. The FCC file has the caller’s number, but we never copy or publish it. We publish only counts by state, month, issue and method.
Can I reuse this robocall and text complaint data?
Yes. It is free under CC BY 4.0. Credit Probative with a link to this page. The full monthly series is free to download too.
The data behind this study, with its API and MCP server: Robocall and text complaint data: FCC dataset and API.
Published by Probative Growth, a marketing agency for law firms. See our services and pricing.
Free
Want your intake checked?
We look at your ads, Google profile and website against your state’s rules, and show you where you stand in Google and AI answers. It’s free.
Not sure where to start? Answer 7 questions Ready to talk? Talk to us Or see what AI says about your firm
Your free review: It covers your Google listing, website, phone and ads, from public information.