
Open data
Law offices in every county: how many there are, how many solo firms, and what they pay
The Bureau of Labor Statistics counted 192,259 private law offices in the United States in 2026 Q1, up 2.4% in a year. They employed 1,120,803 people in the quarter's last month and paid an average of $2,571 a week. 293 of 3,144 counties had no law office at all.
Key facts
- Private law offices, United States
- 192,259
- 2026 Q1, +2.4% in a year
- Jobs in those offices
- 1,120,803
- last month of the quarter, +1.4% in a year
- Average weekly pay
- $2,571
- +5.5% in a year
- Offices per 10,000 residents
- 5.63
- 2.66 in counties outside any metro or micro area
- Counties with no law office
- 293
- of 3,144 counties
- Solo legal-services firms
- 275,103
- no employees, Census 2024: 1.43 for every office
Download the county table (CSV) Cite and download Free under CC BY 4.0. No email or login.
How many law offices are there in your county?
Each county is shaded by private law offices per 10,000 residents (2026 Q1 offices, July 2025 population). Search for a county, choose a state to zoom in, or select a county on the map.
Law offices per 10,000 residents
- None
- Under 1
- 1 – 2.5
- 2.5 – 5
- 5 – 10
- 10 or more
Select a county to see its numbers.
The map needs JavaScript. The tables below and the free files have every county.
What did we find?
- Offices thin out away from metro areas. There are 5.52 private law offices per 10,000 residents in metro counties, 3.24 in micro counties and 2.66 in the 1,300 counties outside both.
- Solo firms sit beside the offices. The Census Bureau counts 275,103 legal-services firms with no employees, 1.43 for every law office with staff. Outside any metro or micro area the ratio is 1.32; in metro counties it is 1.57. The Census file covers all legal services, which is the finest county level it publishes.
- The densest large counties (50,000 residents or more) are Orleans Parish, LA (23.11), District of Columbia, DC (22.04), and New York County, NY (21.76), in offices per 10,000 residents.
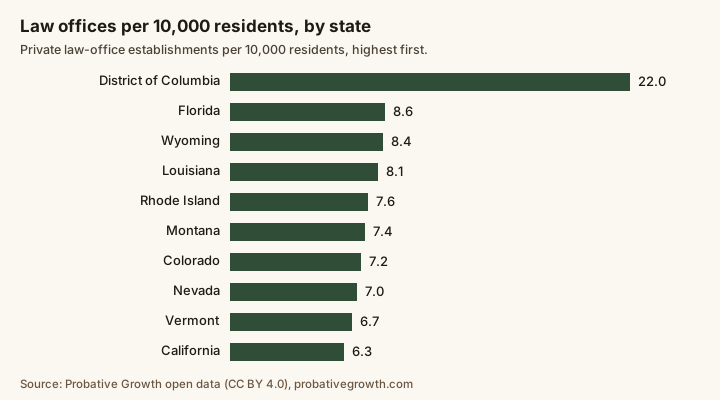
- State rates run from 3.47 to 22.04 offices per 10,000 residents. Highest: District of Columbia (22.04), Florida (8.56), and Wyoming (8.41). Lowest: Wisconsin (3.47), Alaska (3.69), and Indiana (3.71).
- 1,682 of the 2,851 counties with a law office have their jobs and pay withheld by BLS to protect confidentiality. We leave those empty and flag them; the Census counts fill in the picture of how many offices there are.
- 15,121 offices are not placed in any county. BLS counts them under an undefined county, so they are in the state and national totals and in no county row.
Metro, micro and rural counties
The Office of Management and Budget groups counties into metropolitan areas (a core of 50,000 people or more), micropolitan areas (10,000 to 49,999) and neither. This is the 2023 grouping.
| Type of area | Counties | Residents | Offices | Offices per 10,000 | Solo firms | Solo firms per 10,000 | Counties with none |
|---|---|---|---|---|---|---|---|
| Metropolitan area counties | 1,186 | 295,450,885 | 163,164 | 5.52 | 256,124 | 8.67 | 38 |
| Micropolitan area counties | 658 | 28,338,989 | 9,184 | 3.24 | 12,663 | 4.47 | 37 |
| Counties outside both | 1,300 | 17,994,983 | 4,790 | 2.66 | 6,316 | 3.51 | 218 |
Which large counties have the most offices?
| County | Offices | Residents | Offices per 10,000 |
|---|---|---|---|
| Orleans Parish, LA | 837 | 362,154 | 23.11 |
| District of Columbia, DC | 1,529 | 693,645 | 22.04 |
| New York County, NY | 3,622 | 1,664,862 | 21.76 |
| Denver County, CO | 1,427 | 740,613 | 19.27 |
| Fulton County, GA | 2,117 | 1,098,791 | 19.27 |
| Miami-Dade County, FL | 4,331 | 2,802,029 | 15.46 |
| Lafayette Parish, LA | 393 | 257,949 | 15.24 |
| San Francisco County, CA | 1,211 | 826,079 | 14.66 |
| Missoula County, MT | 169 | 123,513 | 13.68 |
| Palm Beach County, FL | 2,125 | 1,575,726 | 13.49 |
Every state
Show all 51 states
| State | Offices | Per 10,000 residents | Solo firms per 10,000 | Jobs | Average weekly pay | Offices, change in a year |
|---|---|---|---|---|---|---|
| Alabama | 2,830 | 5.45 | 7.00 | 13,007 | $1,978 | +2.7% |
| Alaska | 272 | 3.69 | 5.41 | 1,024 | $1,749 | +2.6% |
| Arizona | 3,928 | 5.15 | 6.28 | 17,794 | $2,079 | +1.0% |
| Arkansas | 1,634 | 5.25 | 5.01 | 5,027 | $1,393 | +2.9% |
| California | 24,803 | 6.30 | 10.24 | 149,645 | $2,979 | +4.7% |
| Colorado | 4,331 | 7.20 | 9.14 | 18,871 | $2,702 | +5.9% |
| Connecticut | 2,284 | 6.19 | 9.88 | 11,444 | $2,181 | −1.0% |
| Delaware | 605 | 5.71 | 5.57 | 4,557 | $3,459 | −1.6% |
| District of Columbia | 1,529 | 22.04 | 21.55 | 28,647 | $5,316 | +5.2% |
| Florida | 20,095 | 8.56 | 10.27 | 102,530 | $2,157 | +3.1% |
| Georgia | 7,025 | 6.22 | 7.65 | 35,640 | $2,289 | −0.2% |
| Hawaii | 831 | 5.80 | 7.25 | 2,642 | $1,830 | +1.3% |
| Idaho | 1,231 | 6.06 | 5.44 | 3,533 | $1,585 | −3.5% |
| Illinois | 7,427 | 5.84 | 8.35 | 51,789 | $2,825 | +3.2% |
| Indiana | 2,584 | 3.71 | 4.73 | 13,209 | $1,785 | −0.6% |
| Iowa | 1,294 | 4.00 | 3.52 | 5,954 | $1,540 | −0.5% |
| Kansas | 1,280 | 4.30 | 5.54 | 5,740 | $1,604 | +5.3% |
| Kentucky | 2,409 | 5.23 | 5.83 | 9,752 | $1,556 | +0.2% |
| Louisiana | 3,755 | 8.13 | 10.78 | 16,099 | $1,733 | +1.7% |
| Maine | 696 | 4.92 | 6.75 | 3,439 | $1,843 | −3.6% |
| Maryland | 3,242 | 5.17 | 8.97 | 16,160 | $2,248 | +2.8% |
| Massachusetts | 4,365 | 6.10 | 11.83 | 28,658 | $3,096 | +1.6% |
| Michigan | 4,429 | 4.37 | 7.25 | 23,288 | $2,000 | +1.1% |
| Minnesota | 2,379 | 4.08 | 5.44 | 15,614 | $2,564 | +0.8% |
| Mississippi | 1,632 | 5.52 | 6.92 | 5,612 | $1,534 | +3.4% |
| Missouri | 3,363 | 5.36 | 6.04 | 19,182 | $2,174 | +3.6% |
| Montana | 851 | 7.43 | 7.52 | 2,638 | $1,728 | +5.8% |
| Nebraska | 946 | 4.69 | 4.35 | 5,188 | $1,647 | +4.2% |
| Nevada | 2,299 | 7.00 | 7.49 | 11,597 | $2,050 | +7.2% |
| New Hampshire | 657 | 4.64 | 6.88 | 3,414 | $2,319 | −0.3% |
| New Jersey | 5,296 | 5.55 | 9.52 | 34,199 | $2,298 | +2.2% |
| New Mexico | 1,143 | 5.38 | 6.01 | 4,554 | $1,714 | −0.7% |
| New York | 12,265 | 6.13 | 12.16 | 123,941 | $3,642 | −2.2% |
| North Carolina | 5,451 | 4.87 | 4.89 | 27,483 | $2,112 | +6.8% |
| North Dakota | 356 | 4.45 | 2.86 | 1,456 | $1,498 | +2.6% |
| Ohio | 4,680 | 3.93 | 6.70 | 28,251 | $1,862 | +0.7% |
| Oklahoma | 2,560 | 6.21 | 7.45 | 10,491 | $1,527 | +1.3% |
| Oregon | 2,599 | 6.08 | 6.32 | 11,473 | $2,001 | −0.1% |
| Pennsylvania | 5,642 | 4.32 | 7.47 | 43,305 | $2,454 | +0.5% |
| Rhode Island | 847 | 7.60 | 10.00 | 3,547 | $1,784 | +1.2% |
| South Carolina | 3,357 | 6.03 | 5.94 | 16,768 | $1,846 | +0.6% |
| South Dakota | 426 | 4.56 | 3.92 | 1,572 | $1,394 | +0.9% |
| Tennessee | 3,226 | 4.41 | 6.70 | 14,417 | $2,166 | +8.6% |
| Texas | 16,079 | 5.07 | 8.05 | 95,953 | $2,436 | +2.6% |
| Utah | 1,892 | 5.35 | 6.43 | 9,560 | $2,276 | +2.9% |
| Vermont | 433 | 6.72 | 8.08 | 1,599 | $1,796 | −1.1% |
| Virginia | 4,114 | 4.63 | 6.93 | 23,431 | $2,437 | +3.9% |
| Washington | 3,417 | 4.27 | 6.69 | 19,471 | $2,484 | +2.0% |
| West Virginia | 902 | 5.11 | 5.38 | 4,137 | $1,440 | −0.9% |
| Wisconsin | 2,073 | 3.47 | 4.12 | 12,376 | $1,966 | +5.8% |
| Wyoming | 495 | 8.41 | 8.95 | 1,125 | $1,624 | +3.3% |
The District of Columbia is shown with the states. Jobs and pay are for private offices of lawyers.
The last eight quarters
| Quarter | Offices | Jobs, last month | Average weekly pay |
|---|---|---|---|
| 2024 Q2 | 188,298 | 1,109,834 | $2,290 |
| 2024 Q3 | 188,822 | 1,095,699 | $2,331 |
| 2024 Q4 | 189,625 | 1,115,306 | $3,545 |
| 2025 Q1 | 187,831 | 1,104,885 | $2,437 |
| 2025 Q2 | 188,628 | 1,132,924 | $2,414 |
| 2025 Q3 | 190,097 | 1,115,481 | $2,443 |
| 2025 Q4 | 191,754 | 1,140,063 | $3,755 |
| 2026 Q1 | 192,259 | 1,120,803 | $2,571 |
How did we build it?
We download the Bureau of Labor Statistics’ open-data file of the Quarterly Census of Employment and Wages for private offices of lawyers (NAICS 541110) for the last eight quarters. Each county, state and U.S. row is joined by FIPS code to the Census Bureau’s County Business Patterns 2023, which we keep exactly as already published; to Nonemployer Statistics 2024; and to the July 2025 population estimates. The state rows are the agency’s own, and they add up to the U.S. row.
A script re-reads every source and checks the records against it; the check is published in the repository with the pull. The data refreshes when BLS releases a new quarter, about five months after the quarter ends.
What these numbers are not
- Offices, not lawyers. We never call these counts lawyers. An office of lawyers is an establishment, with its support staff.
- Suppressed means empty. Where BLS withholds a county’s jobs and pay, we show them empty and flagged. We never fill them in.
- Two office counts. BLS counts establishments with employees in the latest quarter; the Census counts employer offices in 2023, with noise added to jobs and payroll. We keep both and say which is which.
- Solo firms are all legal services. The Census publishes nonemployer firms for legal services as a whole (NAICS 5411) at county level. They include lawyers who work alone, and also notaries, paralegals and similar businesses. A county with no row in that file is shown with none.
- Population and period. Rates divide a 2026 quarter by the July 2025 population estimate; the nearest year available.
- Connecticut is shown as its nine planning regions, the geography the Census Bureau and BLS now use.
- Not legal advice, and no ranking of any office or lawyer.
How to cite this study
You can reuse, adapt and republish this data, including commercially, under the Creative Commons Attribution 4.0 license (CC BY 4.0). The only condition is that you credit Probative and link to the source.
- Version
- 1.0.0, released October 28, 2026
- Every version
- 10.5281/zenodo.23721414 (always points to the newest)
- License
- CC BY 4.0
Download the data
- CSV: data.csv 223 KB · one row per county: offices, jobs, pay, solo firms and rates
- JSON: law-offices.json Full records with every quarter (JSON)
Free, no email or login. The files are hosted on this site and Zenodo, a public research archive.
Suggested citation
Probative. (2026). Law offices, jobs and pay by county, with solo-practice counts: BLS QCEW, Census CBP and Nonemployer Statistics (Version 1.0.0) [Data set]. Zenodo. https://doi.org/10.5281/zenodo.23721415
Credit line for a chart, table or article
Source: Probative, Law offices, jobs and pay by county, with solo-practice counts: BLS QCEW, Census CBP and Nonemployer Statistics, version 1.0.0, https://doi.org/10.5281/zenodo.23721415, licensed CC BY 4.0.
Not legal advice. These are counts from official statistics, kept for marketing planning. The agencies revise them; check the current release.
Embed a county card
Put one county’s law-office counts on your own site or blog. The example below is Los Angeles County; replace 06037 in the address with your county’s five-digit FIPS code (the details panel on the map has a link for each county). Preview the card.
Does your site remove iframes? Copy an image or a table instead
The image and the table show the study’s main chart, not one card. Each carries the same credit line.
Where can I read more?
- Counties with few or no offices: the legal-deserts study, with lawyers per 1,000 residents where state bars publish county counts.
- The first county table, with the ABA’s lawyers by state: lawyer offices per county.
- The agency pages: BLS QCEW open data and Census County Business Patterns.
Questions about this study
How many law offices are there in the United States?
192,259 private offices of lawyers in 2026 Q1, according to the Bureau of Labor Statistics, up 2.4% from a year earlier. The Census Bureau’s County Business Patterns counted 164,612 employer offices in 2023.
Which county has the most law offices per resident?
Among counties with 50,000 residents or more, Orleans Parish, LA, with 23.11 private law offices per 10,000 residents, then District of Columbia, DC (22.04) and New York County, NY (21.76).
How many counties have no law office?
293 of 3,144 counties had no private law-office establishment in the BLS count for 2026 Q1. The legal-deserts study lists them and shows how many also have no solo legal-services firm.
Why are jobs and pay empty for some counties?
The Bureau of Labor Statistics withholds employment and pay where publishing them could reveal one employer. That is 1,682 counties. We leave the values empty and flagged; we do not estimate them.
Is an office the same as a lawyer?
No. An office of lawyers is an establishment. It includes lawyers and support staff, and one office can hold many lawyers. These counts are not numbers of lawyers.
Where does the data come from, and can I reuse it?
From the Bureau of Labor Statistics (Quarterly Census of Employment and Wages) and the Census Bureau (County Business Patterns, Nonemployer Statistics, Population Estimates), all U.S. government statistics. Our compiled files are free under CC BY 4.0: credit Probative with a link to this page.
Free
Want us to look at your ads?
We review your ads, your Google profile and your website against your state’s rules, and show you where you stand in Google and in AI answers. It is free.
Not sure where to start? Answer 7 questions Ready to talk? Talk to us
Your free review: It covers your Google listing, website, phone and ads, from public information.