
Open data
Legal deserts: which counties have no law office, and how many people live there
Of 3,144 counties, 440 have fewer than one private law office per 10,000 residents, and 293 have none at all, according to the Bureau of Labor Statistics count for 2026 Q1. 6,817,871 people, 2.0% of residents, live in a county below that line. Where four state bars and courts publish lawyer counts by county, we show those too.
Key facts
- Counties with no law office
- 293
- of 3,144; 1,614,616 residents
- Counties under 1 office per 10,000 residents
- 440
- 2.0% of residents live in one
- Counties with no office and no solo firm
- 227
- no employer office and no nonemployer legal-services firm in the Census file
- Rural counties with no law office
- 218
- of 1,300 outside any metro or micro area (16.8%)
- Mississippi counties under 1 lawyer per 1,000
- 51
- of 82, from The Mississippi Bar
- California counties under 1 lawyer per 1,000
- 17
- of 57 the State Bar lists
Download the county table (CSV) Cite and download Free under CC BY 4.0. No email or login.
Which counties are under the line?
Counties with no law office are dark red, and those under one office per 10,000 residents are light red. Search for a county, choose a state to zoom in, or select a county to see its numbers and, in California, New York, Mississippi and Illinois, its lawyer count.
Law offices per 10,000 residents
- No law office
- Under 1 per 10,000
- 1 or more
Select a county to see its numbers.
The map needs JavaScript. The tables below and the free files have every county.
What did we find?
- 218 of the 1,300 counties outside any metro or micro area have no law office. That is 16.8% of them, against 3.2% of metro counties and 5.6% of micro counties.
- 274 of those 1,300 rural counties have fewer than one office per 10,000 residents. The 227 counties with no office and no solo firm at all are listed below.
- Two definitions give different maps. By offices, 440 counties are under 1 per 10,000 residents. By lawyers, where a bar count exists, 51 of 82 Mississippi counties, 46 of 102 Illinois counties, 17 of 57 California counties and 12 of 62 New York counties are under 1 lawyer per 1,000 residents.
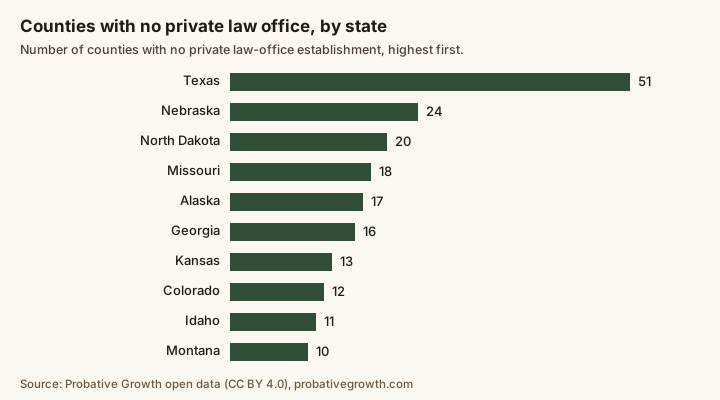
- Statewide, the share of residents in a thin county varies widely. North Dakota (10.4%), Alaska (8.7%), Arizona (8.0%) lead; most states are below 5%.
Two definitions, side by side
Offices: fewer than one private law-office establishment per 10,000 residents (BLS QCEW, latest quarter; July 2025 population), and, separately, none at all. Lawyers: fewer than one lawyer per 1,000 residents, only where a state’s own bar or court publishes a county count. They are not interchangeable: an office can hold many lawyers, and a lawyer’s address of record is not always where they practise.
| Type of area | Counties | Under 1 office per 10,000 | No office | No office and no solo firm | Residents in counties under 1 per 10,000 |
|---|---|---|---|---|---|
| Metropolitan area counties | 1,186 | 102 | 38 | 23 | 3,500,839 |
| Micropolitan area counties | 658 | 64 | 37 | 28 | 1,048,153 |
| Counties outside both | 1,300 | 274 | 218 | 176 | 2,268,879 |
Lawyers per 1,000 residents, where states publish them
| State | Counties counted | Lawyers counted | Lawyers per 1,000 residents | Counties under 1 per 1,000 | What the state counts |
|---|---|---|---|---|---|
| California | 57 | 172,421 | 4.38 | 17 | Active members of the State Bar, by county of record; judges and inactive members are counted separately |
| Illinois | 102 | 65,456 | 5.15 | 46 | Active and inactive registered lawyers together, by principal business address |
| Mississippi | 82 | 6,638 | 2.25 | 51 | Active members with a Mississippi county of record; judges are included |
| New York | 62 | 132,876 | 6.64 | 12 | Attorneys with a New York address whose registration is current, from the court system’s open data |
The four definitions differ, so the states are not ranked against each other. California lists 57 of its 58 counties; the county missing from its table (Alpine) is shown without a count.
Every state
Show all 51 states
| State | Counties | Under 1 office per 10,000 | No office | Residents in those counties |
|---|---|---|---|---|
| Alabama | 67 | 1 | 0 | 0.4% |
| Alaska | 30 | 17 | 17 | 8.7% |
| Arizona | 15 | 3 | 1 | 8.0% |
| Arkansas | 75 | 12 | 9 | 4.3% |
| California | 58 | 4 | 3 | 0.5% |
| Colorado | 64 | 12 | 12 | 0.7% |
| Connecticut | 9 | 0 | 0 | 0.0% |
| Delaware | 3 | 0 | 0 | 0.0% |
| District of Columbia | 1 | 0 | 0 | 0.0% |
| Florida | 67 | 7 | 2 | 0.9% |
| Georgia | 159 | 30 | 16 | 3.5% |
| Hawaii | 5 | 1 | 1 | 0.0% |
| Idaho | 44 | 12 | 11 | 3.9% |
| Illinois | 102 | 13 | 6 | 1.6% |
| Indiana | 92 | 8 | 2 | 2.1% |
| Iowa | 99 | 5 | 3 | 1.8% |
| Kansas | 105 | 14 | 13 | 2.3% |
| Kentucky | 120 | 5 | 2 | 1.2% |
| Louisiana | 64 | 4 | 1 | 1.3% |
| Maine | 16 | 0 | 0 | 0.0% |
| Maryland | 24 | 1 | 0 | 0.4% |
| Massachusetts | 14 | 0 | 0 | 0.0% |
| Michigan | 83 | 12 | 7 | 3.2% |
| Minnesota | 87 | 11 | 6 | 6.2% |
| Mississippi | 82 | 5 | 2 | 2.5% |
| Missouri | 115 | 27 | 18 | 4.8% |
| Montana | 56 | 10 | 10 | 1.6% |
| Nebraska | 93 | 25 | 24 | 2.8% |
| Nevada | 17 | 5 | 4 | 2.3% |
| New Hampshire | 10 | 0 | 0 | 0.0% |
| New Jersey | 21 | 0 | 0 | 0.0% |
| New Mexico | 33 | 7 | 5 | 4.4% |
| New York | 62 | 3 | 1 | 0.7% |
| North Carolina | 100 | 6 | 2 | 1.0% |
| North Dakota | 53 | 20 | 20 | 10.4% |
| Ohio | 88 | 5 | 0 | 1.4% |
| Oklahoma | 77 | 9 | 5 | 2.6% |
| Oregon | 36 | 4 | 3 | 0.4% |
| Pennsylvania | 67 | 2 | 1 | 0.5% |
| Rhode Island | 5 | 0 | 0 | 0.0% |
| South Carolina | 46 | 1 | 0 | 0.4% |
| South Dakota | 66 | 10 | 10 | 2.8% |
| Tennessee | 95 | 5 | 2 | 1.0% |
| Texas | 254 | 71 | 51 | 3.1% |
| Utah | 29 | 10 | 6 | 4.9% |
| Vermont | 14 | 1 | 1 | 1.2% |
| Virginia | 133 | 23 | 9 | 7.0% |
| Washington | 39 | 4 | 1 | 2.2% |
| West Virginia | 55 | 3 | 2 | 1.7% |
| Wisconsin | 72 | 12 | 4 | 6.3% |
| Wyoming | 23 | 0 | 0 | 0.0% |
Counties with no law office
Show all 293 counties
| County | Residents | Solo legal-services firms (Census) | Area type |
|---|---|---|---|
| Shawano County, WI | 41,560 | 8 | Micropolitan |
| Clark County, WI | 35,052 | 8 | Outside both |
| New Kent County, VA | 28,022 | 21 | Metropolitan |
| Johnson County, AR | 26,225 | 3 | Outside both |
| Washington County, MO | 23,810 | 3 | Outside both |
| Grant Parish, LA | 22,075 | 5 | Metropolitan |
| Holmes County, FL | 20,119 | 3 | Outside both |
| Frio County, TX | 18,823 | 3 | Outside both |
| Kalkaska County, MI | 18,693 | 10 | Metropolitan |
| Manassas Park city, VA | 16,560 | 6 | Metropolitan |
| Scurry County, TX | 16,162 | 6 | Micropolitan |
| Torrance County, NM | 16,100 | 4 | Metropolitan |
| Missaukee County, MI | 15,274 | 0 | Micropolitan |
| Fulton County, PA | 14,483 | 6 | Outside both |
| Fremont County, ID | 14,208 | 5 | Micropolitan |
| Meigs County, TN | 14,186 | 8 | Micropolitan |
| Clay County, AR | 14,052 | 3 | Outside both |
| Zapata County, TX | 13,753 | 3 | Micropolitan |
| Juab County, UT | 13,567 | 4 | Metropolitan |
| Buffalo County, WI | 13,318 | 3 | Outside both |
| Poquoson city, VA | 13,292 | 7 | Metropolitan |
| Lake County, MI | 13,182 | 0 | Outside both |
| Lamb County, TX | 12,579 | 0 | Outside both |
| Cass County, IL | 12,463 | 0 | Outside both |
| Newton County, TX | 11,954 | 4 | Outside both |
| Linn County, MO | 11,815 | 0 | Outside both |
| Rolette County, ND | 11,688 | 8 | Outside both |
| Marion County, KS | 11,634 | 3 | Outside both |
| Montgomery County, MO | 11,590 | 5 | Outside both |
| Camden County, NC | 11,315 | 0 | Metropolitan |
| Greensville County, VA | 11,181 | 0 | Outside both |
| Bollinger County, MO | 10,646 | 0 | Metropolitan |
| North Slope Borough, AK | 10,582 | 0 | Outside both |
| Barnes County, ND | 10,573 | 0 | Outside both |
| Cumberland County, VA | 10,352 | 0 | Outside both |
| Emery County, UT | 10,177 | 0 | Outside both |
| Sabine County, TX | 10,012 | 0 | Outside both |
| Pike County, AR | 9,964 | 6 | Outside both |
| Montmorency County, MI | 9,842 | 0 | Outside both |
| Jack County, TX | 9,563 | 6 | Outside both |
| Mountrail County, ND | 9,395 | 4 | Outside both |
| Iron County, MO | 9,318 | 0 | Outside both |
| Greenlee County, AZ | 9,312 | 3 | Outside both |
| Johnson County, GA | 9,310 | 3 | Micropolitan |
| Carroll County, MS | 9,226 | 0 | Micropolitan |
| Archer County, TX | 9,129 | 4 | Metropolitan |
| Hickory County, MO | 9,044 | 3 | Outside both |
| Zavala County, TX | 9,037 | 0 | Outside both |
| Jasper County, IL | 9,032 | 0 | Outside both |
| Caldwell County, MO | 9,012 | 6 | Metropolitan |
| Palo Alto County, IA | 8,899 | 0 | Outside both |
| Marshall County, MN | 8,798 | 0 | Outside both |
| Wilcox County, GA | 8,797 | 3 | Outside both |
| Clearwater County, MN | 8,647 | 3 | Outside both |
| Kane County, UT | 8,597 | 0 | Outside both |
| Montgomery County, AR | 8,579 | 0 | Outside both |
| Boise County, ID | 8,545 | 7 | Metropolitan |
| Warren County, IN | 8,474 | 0 | Metropolitan |
| Modoc County, CA | 8,426 | 9 | Outside both |
| Maries County, MO | 8,397 | 0 | Outside both |
| Harrison County, MO | 8,281 | 0 | Outside both |
| Power County, ID | 8,246 | 0 | Outside both |
| Baraga County, MI | 8,169 | 0 | Outside both |
| Liberty County, FL | 8,035 | 0 | Outside both |
| Kusilvak Census Area, AK | 7,932 | 0 | Outside both |
| Prairie County, AR | 7,923 | 0 | Outside both |
| Taylor County, GA | 7,818 | 5 | Outside both |
| Dade County, MO | 7,804 | 0 | Outside both |
| San Augustine County, TX | 7,722 | 5 | Outside both |
| Marion County, GA | 7,676 | 0 | Metropolitan |
| Twiggs County, GA | 7,597 | 0 | Metropolitan |
| Winkler County, TX | 7,540 | 0 | Outside both |
| Conejos County, CO | 7,529 | 0 | Micropolitan |
| Grand Isle County, VT | 7,511 | 7 | Metropolitan |
| Pleasants County, WV | 7,338 | 0 | Outside both |
| Castro County, TX | 7,295 | 0 | Outside both |
| Southeast Fairbanks Census Area, AK | 7,270 | 0 | Outside both |
| Elliott County, KY | 7,265 | 4 | Outside both |
| Caribou County, ID | 7,252 | 3 | Outside both |
| Cleveland County, AR | 7,224 | 0 | Micropolitan |
| Van Buren County, IA | 7,131 | 0 | Outside both |
| Newton County, AR | 7,026 | 0 | Micropolitan |
| Wabaunsee County, KS | 7,018 | 6 | Metropolitan |
| Bailey County, TX | 6,963 | 0 | Outside both |
| Hamlin County, SD | 6,900 | 0 | Outside both |
| Van Buren County, TN | 6,874 | 4 | Outside both |
| Jefferson County, MS | 6,825 | 4 | Micropolitan |
| King and Queen County, VA | 6,743 | 4 | Metropolitan |
| Bear Lake County, ID | 6,727 | 0 | Outside both |
| Swisher County, TX | 6,703 | 3 | Outside both |
| Charles City County, VA | 6,623 | 0 | Metropolitan |
| Surry County, VA | 6,603 | 0 | Metropolitan |
| Chugach Census Area, AK | 6,553 | 0 | Outside both |
| Treutlen County, GA | 6,466 | 0 | Outside both |
| Menifee County, KY | 6,430 | 5 | Micropolitan |
| Wilkin County, MN | 6,288 | 0 | Micropolitan |
| Ohio County, IN | 5,994 | 0 | Metropolitan |
| Reynolds County, MO | 5,992 | 0 | Outside both |
| Calhoun County, WV | 5,978 | 0 | Outside both |
| Edwards County, IL | 5,898 | 0 | Outside both |
| Lafayette County, AR | 5,888 | 0 | Outside both |
| Ontonagon County, MI | 5,823 | 4 | Outside both |
| Benson County, ND | 5,759 | 0 | Outside both |
| Stanton County, NE | 5,744 | 0 | Micropolitan |
| Sullivan County, MO | 5,738 | 0 | Outside both |
| Bent County, CO | 5,716 | 0 | Outside both |
| Talbot County, GA | 5,709 | 4 | Metropolitan |
| Crowley County, CO | 5,677 | 0 | Outside both |
| Lincoln County, CO | 5,645 | 0 | Outside both |
| Putnam County, IL | 5,619 | 0 | Micropolitan |
| Lincoln County, ID | 5,603 | 0 | Micropolitan |
| Dixon County, NE | 5,602 | 0 | Outside both |
| Custer County, CO | 5,590 | 5 | Outside both |
| Musselshell County, MT | 5,582 | 0 | Outside both |
| Cotton County, OK | 5,432 | 0 | Metropolitan |
| Carter County, MO | 5,418 | 0 | Outside both |
| Morris County, KS | 5,348 | 0 | Outside both |
| Martin County, TX | 5,284 | 0 | Metropolitan |
| Polk County, NE | 5,270 | 0 | Outside both |
| Garfield County, UT | 5,256 | 0 | Outside both |
| Aleutians West Census Area, AK | 5,240 | 0 | Outside both |
| McHenry County, ND | 5,130 | 0 | Metropolitan |
| Oneida County, ID | 5,085 | 0 | Micropolitan |
| Big Stone County, MN | 5,054 | 0 | Outside both |
| Yukon-Koyukuk Census Area, AK | 5,028 | 0 | Outside both |
| Adams County, ID | 5,013 | 5 | Outside both |
| Hamilton County, NY | 5,006 | 7 | Outside both |
| Hartley County, TX | 4,904 | 3 | Outside both |
| Dickey County, ND | 4,895 | 0 | Outside both |
| Floyd County, TX | 4,881 | 0 | Micropolitan |
| Pulaski County, IL | 4,820 | 4 | Outside both |
| Craig County, VA | 4,800 | 0 | Metropolitan |
| Wheeler County, TX | 4,773 | 3 | Outside both |
| Ringgold County, IA | 4,642 | 0 | Outside both |
| Custer County, ID | 4,636 | 3 | Outside both |
| Calhoun County, AR | 4,632 | 0 | Micropolitan |
| Stewart County, GA | 4,631 | 0 | Metropolitan |
| Schley County, GA | 4,593 | 0 | Micropolitan |
| Jim Hogg County, TX | 4,555 | 3 | Outside both |
| Hyde County, NC | 4,554 | 0 | Outside both |
| Garza County, TX | 4,510 | 6 | Metropolitan |
| Mineral County, NV | 4,407 | 0 | Outside both |
| Guadalupe County, NM | 4,343 | 0 | Outside both |
| Storey County, NV | 4,260 | 0 | Metropolitan |
| Dewey County, OK | 4,207 | 0 | Outside both |
| Holt County, MO | 4,200 | 0 | Outside both |
| Menominee County, WI | 4,199 | 0 | Micropolitan |
| Schuyler County, MO | 4,140 | 0 | Micropolitan |
| LaMoure County, ND | 4,135 | 0 | Outside both |
| Grant County, OK | 4,067 | 0 | Outside both |
| Dunn County, ND | 4,058 | 0 | Micropolitan |
| Mora County, NM | 4,051 | 0 | Micropolitan |
| Kearny County, KS | 3,888 | 0 | Outside both |
| Corson County, SD | 3,781 | 0 | Outside both |
| Lake of the Woods County, MN | 3,770 | 0 | Outside both |
| Wells County, ND | 3,729 | 0 | Outside both |
| Knox County, MO | 3,728 | 0 | Outside both |
| Chase County, NE | 3,718 | 0 | Outside both |
| Sargent County, ND | 3,711 | 0 | Outside both |
| Fisher County, TX | 3,692 | 0 | Outside both |
| Echols County, GA | 3,685 | 0 | Metropolitan |
| Costilla County, CO | 3,679 | 0 | Micropolitan |
| Ellis County, OK | 3,613 | 0 | Outside both |
| Hardin County, IL | 3,588 | 0 | Outside both |
| Aleutians East Borough, AK | 3,479 | 0 | Outside both |
| Hudspeth County, TX | 3,433 | 0 | Metropolitan |
| Coke County, TX | 3,412 | 0 | Outside both |
| Mercer County, MO | 3,404 | 0 | Outside both |
| Petersburg Borough, AK | 3,394 | 0 | Outside both |
| Webster County, NE | 3,336 | 0 | Micropolitan |
| Chautauqua County, KS | 3,321 | 4 | Outside both |
| Hardeman County, TX | 3,292 | 0 | Outside both |
| Roger Mills County, OK | 3,259 | 0 | Outside both |
| Emmons County, ND | 3,215 | 0 | Outside both |
| Shackelford County, TX | 3,197 | 3 | Outside both |
| Knox County, TX | 3,192 | 0 | Outside both |
| Glascock County, GA | 3,141 | 0 | Outside both |
| Upton County, TX | 3,131 | 0 | Outside both |
| Traverse County, MN | 3,130 | 0 | Outside both |
| Kinney County, TX | 3,128 | 0 | Outside both |
| Woodson County, KS | 3,118 | 4 | Outside both |
| Sierra County, CA | 3,098 | 5 | Outside both |
| Harlan County, NE | 3,000 | withheld | Outside both |
| Lipscomb County, TX | 2,955 | 0 | Outside both |
| Clay County, GA | 2,815 | 0 | Outside both |
| Real County, TX | 2,745 | 0 | Outside both |
| Baker County, GA | 2,725 | 0 | Outside both |
| Copper River Census Area, AK | 2,666 | 0 | Outside both |
| Jackson County, SD | 2,666 | 0 | Outside both |
| Ness County, KS | 2,617 | 0 | Outside both |
| Chase County, KS | 2,572 | 0 | Micropolitan |
| Cochran County, TX | 2,546 | 0 | Metropolitan |
| Hitchcock County, NE | 2,467 | 0 | Outside both |
| Elk County, KS | 2,458 | 0 | Outside both |
| Garfield County, WA | 2,416 | 0 | Outside both |
| Kidder County, ND | 2,393 | 0 | Outside both |
| Sanborn County, SD | 2,388 | 0 | Micropolitan |
| Webster County, GA | 2,369 | 0 | Outside both |
| McPherson County, SD | 2,347 | 0 | Outside both |
| Renville County, ND | 2,331 | 0 | Metropolitan |
| Hoonah-Angoon Census Area, AK | 2,271 | 0 | Outside both |
| Culberson County, TX | 2,267 | 0 | Outside both |
| Quitman County, GA | 2,254 | 0 | Micropolitan |
| Sedgwick County, CO | 2,247 | 0 | Outside both |
| Griggs County, ND | 2,239 | 0 | Outside both |
| Grant County, ND | 2,206 | 0 | Outside both |
| Keweenaw County, MI | 2,186 | 0 | Micropolitan |
| Faulk County, SD | 2,178 | 0 | Outside both |
| Greeley County, NE | 2,154 | 0 | Outside both |
| Mellette County, SD | 2,137 | 0 | Outside both |
| Wheatland County, MT | 2,100 | 0 | Outside both |
| Haines Borough, AK | 2,068 | 0 | Outside both |
| Sherman County, OR | 2,051 | 0 | Outside both |
| Wichita County, KS | 2,031 | 0 | Outside both |
| Wrangell City and Borough, AK | 2,007 | 0 | Outside both |
| Gilliam County, OR | 1,971 | 0 | Outside both |
| Worth County, MO | 1,914 | 4 | Outside both |
| Clark County, KS | 1,900 | 0 | Outside both |
| Oliver County, ND | 1,898 | 0 | Metropolitan |
| Eureka County, NV | 1,867 | 0 | Micropolitan |
| Deuel County, NE | 1,862 | 0 | Outside both |
| Armstrong County, TX | 1,843 | 0 | Metropolitan |
| Golden Valley County, ND | 1,808 | 0 | Outside both |
| Garden County, NE | 1,804 | 0 | Outside both |
| Steele County, ND | 1,797 | 0 | Outside both |
| Oldham County, TX | 1,783 | 0 | Metropolitan |
| Powder River County, MT | 1,781 | 0 | Outside both |
| McCone County, MT | 1,720 | 0 | Outside both |
| Cheyenne County, CO | 1,713 | 0 | Outside both |
| Jeff Davis County, TX | 1,711 | 4 | Outside both |
| Garfield County, NE | 1,710 | 0 | Outside both |
| Boyd County, NE | 1,674 | 0 | Outside both |
| Comanche County, KS | 1,673 | 0 | Outside both |
| Taliaferro County, GA | 1,662 | 0 | Outside both |
| De Baca County, NM | 1,647 | 0 | Outside both |
| Hodgeman County, KS | 1,619 | 0 | Outside both |
| Denali Borough, AK | 1,616 | 0 | Outside both |
| Daniels County, MT | 1,612 | 0 | Outside both |
| Throckmorton County, TX | 1,554 | 0 | Outside both |
| Piute County, UT | 1,509 | 0 | Outside both |
| Briscoe County, TX | 1,474 | 0 | Outside both |
| Wheeler County, OR | 1,472 | 0 | Outside both |
| Irion County, TX | 1,463 | 0 | Metropolitan |
| Kiowa County, CO | 1,412 | 0 | Outside both |
| Carter County, MT | 1,383 | 0 | Outside both |
| Edwards County, TX | 1,370 | 0 | Outside both |
| Lake and Peninsula Borough, AK | 1,357 | 0 | Outside both |
| Sterling County, TX | 1,349 | 0 | Outside both |
| Harding County, SD | 1,331 | 0 | Outside both |
| Camas County, ID | 1,316 | 0 | Micropolitan |
| Sheridan County, ND | 1,296 | 0 | Outside both |
| Cottle County, TX | 1,224 | 0 | Outside both |
| Jackson County, CO | 1,211 | 0 | Outside both |
| Hyde County, SD | 1,191 | 0 | Outside both |
| Garfield County, MT | 1,148 | 0 | Outside both |
| Glasscock County, TX | 1,128 | 0 | Outside both |
| Prairie County, MT | 1,112 | 0 | Outside both |
| Skagway Municipality, AK | 1,104 | 0 | Outside both |
| Alpine County, CA | 1,043 | 5 | Micropolitan |
| Motley County, TX | 1,043 | 0 | Outside both |
| Daggett County, UT | 934 | 0 | Outside both |
| Jones County, SD | 913 | 0 | Outside both |
| Mineral County, CO | 910 | 0 | Outside both |
| Roberts County, TX | 867 | 0 | Micropolitan |
| Bristol Bay Borough, AK | 847 | 0 | Outside both |
| Golden Valley County, MT | 844 | 0 | Outside both |
| Hayes County, NE | 821 | 0 | Outside both |
| San Juan County, CO | 813 | 0 | Outside both |
| Keya Paha County, NE | 792 | 0 | Outside both |
| Wheeler County, NE | 789 | 0 | Outside both |
| Clark County, ID | 783 | 0 | Outside both |
| Esmeralda County, NV | 729 | 0 | Outside both |
| Terrell County, TX | 702 | 0 | Outside both |
| Banner County, NE | 686 | 0 | Micropolitan |
| Hooker County, NE | 686 | 0 | Outside both |
| Kent County, TX | 674 | 0 | Outside both |
| Yakutat City and Borough, AK | 672 | 0 | Outside both |
| Logan County, NE | 669 | 0 | Micropolitan |
| Thomas County, NE | 639 | 0 | Outside both |
| Slope County, ND | 628 | 0 | Outside both |
| Harding County, NM | 617 | 0 | Outside both |
| Loup County, NE | 570 | 0 | Outside both |
| Borden County, TX | 567 | 0 | Outside both |
| Grant County, NE | 561 | 0 | Outside both |
| Petroleum County, MT | 548 | 0 | Outside both |
| McMullen County, TX | 544 | 0 | Outside both |
| Blaine County, NE | 458 | 0 | Outside both |
| Arthur County, NE | 396 | 0 | Outside both |
| McPherson County, NE | 369 | 0 | Outside both |
| Kenedy County, TX | 319 | 0 | Outside both |
| King County, TX | 192 | 0 | Outside both |
| Kalawao County, HI | 82 | 0 | Metropolitan |
| Loving County, TX | 52 | 0 | Outside both |
No law office means no private establishment in NAICS 541110 in the BLS count. Residents can still be served by offices in a nearby county.
How did we build it?
We start from our law-offices dataset: each county’s private law-office establishments in the latest BLS quarter, the Census count of solo legal-services firms, and the July 2025 population estimate. A county is flagged when it has under one office per 10,000 residents, and separately when it has none. Metropolitan and micropolitan status is the 2023 federal grouping.
For lawyers we read four official county tables: the State Bar of California’s attorney demographics page, the New York court system’s open attorney-registration data (we ask the server for county and status totals only, never a name or address), The Mississippi Bar’s July 2026 membership report and the Illinois Attorney Registration and Disciplinary Commission’s 2024 annual report. Mississippi and Illinois add up exactly to the source’s own total; California’s counties add up to 4 fewer than the State Bar’s state row, which counts members with no county listed.
What these numbers are not
- Offices are not lawyers, and lawyers are not access. Both lines are counts. Neither says whether residents can reach a lawyer.
- A bar address is not a place of practice. Bar counts use the address of record, include members who do not practise in the county, and are not comparable between states.
- New York counts only current registrations with a New York address; other statuses, such as retired or delinquent, are left out.
- Illinois counts active and inactive lawyers together. That makes its rate higher than an active-only count would be.
- Only four states publish a county count. Counties elsewhere show no lawyer figure rather than an estimate.
- Solo firms are all legal services. The Census file covers legal services as a whole (NAICS 5411) and withholds some counties.
- Not legal advice, and not a finding about anyone’s access to justice.
How to cite this study
You can reuse, adapt and republish this data, including commercially, under the Creative Commons Attribution 4.0 license (CC BY 4.0). The only condition is that you credit Probative and link to the source.
- Version
- 1.0.0, released October 28, 2026
- Every version
- 10.5281/zenodo.23721429 (always points to the newest)
- License
- CC BY 4.0
Download the data
- CSV: data.csv 266 KB · one row per county: offices, solo firms, both flags and, where published, lawyers
- JSON: deserts.json Full records with sources (JSON)
Free, no email or login. The files are hosted on this site and Zenodo, a public research archive.
Suggested citation
Probative. (2026). Legal deserts: law offices and lawyers per resident in every U.S. county (Version 1.0.0) [Data set]. Zenodo. https://doi.org/10.5281/zenodo.23721430
Credit line for a chart, table or article
Source: Probative, Legal deserts: law offices and lawyers per resident in every U.S. county, version 1.0.0, https://doi.org/10.5281/zenodo.23721430, licensed CC BY 4.0.
Not legal advice. These are counts from official statistics, kept for marketing planning. The agencies revise them; check the current release.
Embed a county card
Put one county’s legal-desert numbers on your own site or blog, for example a state bar or a legal-aid page. The example is Loving County, Texas; replace 48301 in the address with your county’s five-digit FIPS code (the details panel on the map has a link for each county). Preview the card.
Does your site remove iframes? Copy an image or a table instead
The image and the table show the study’s main chart, not one card. Each carries the same credit line.
Where can I read more?
- Law offices in every county, quarter by quarter: the law-offices study.
- The source pages: BLS QCEW open data, State Bar of California, NYS Attorney Registrations, Illinois ARDC annual report.
Questions about this study
What is a legal desert?
There is no single definition, so we show two. By offices: a county with fewer than one private law office per 10,000 residents (440 counties), or none (293). By lawyers: fewer than one lawyer per 1,000 residents, where a state publishes a county count.
How many counties have no law office?
293 of 3,144 counties had no private law-office establishment in the Bureau of Labor Statistics count for 2026 Q1, with 1,614,616 residents between them. 227 of them also have no solo legal-services firm in the Census file.
Are rural counties more likely to have none?
Yes. 218 of 1,300 counties outside any metro or micro area (16.8%) have no law office, against 3.2% of metro counties.
Why only four states for lawyer counts?
Only California, New York, Mississippi and Illinois publish lawyer counts by county in a form we can read and cite. We do not estimate the rest. Each state counts different lawyers, so the four are not ranked against each other.
Does a county with no office have no access to a lawyer?
Not necessarily. Lawyers based in a neighbouring county or working remotely may serve it. These are counts of offices and lawyers, not findings about access to justice.
Where does the data come from, and can I reuse it?
From the Bureau of Labor Statistics, the Census Bureau, the State Bar of California, the New York State Unified Court System, The Mississippi Bar and the Illinois Attorney Registration and Disciplinary Commission. Our compiled files are free under CC BY 4.0: credit Probative with a link to this page.
Free
Want us to look at your ads?
We review your ads, your Google profile and your website against your state’s rules, and show you where you stand in Google and in AI answers. It is free.
Not sure where to start? Answer 7 questions Ready to talk? Talk to us
Your free review: It covers your Google listing, website, phone and ads, from public information.