
Research
Debt-collection complaints by state: CFPB data
In the 12 months to September 2026, people filed 324,224 debt-collection complaints with the Consumer Financial Protection Bureau (CFPB), 94.9 for every 100,000 residents. The rate runs from 10.8 in Puerto Rico to 235.7 in Georgia.
Key facts
- Debt-collection complaints, last 12 months
- 324,224
- to September 2026
- Per 100,000 residents
- 94.9
- United States
- Highest rate
- 235.7
- Georgia, per 100,000 residents
- Lowest rate
- 10.8
- Puerto Rico, per 100,000 residents
- Change on the 12 months before
- +28.6%
- debt collection, nationwide
- Answered on time
- 96.5%
- of debt-collection complaints
Download the state table (CSV) Full monthly series since 2018 Free under CC BY 4.0. No email or login.
What is a CFPB complaint?
When someone has a problem with a debt collector, a credit bureau or a credit-repair or debt-management company, they can report it to the Consumer Financial Protection Bureau. The bureau sends it to the company, and publishes it once the company responds. It posts the counts in a public database; we keep the state-by-month history and set it against population.
What did we find?
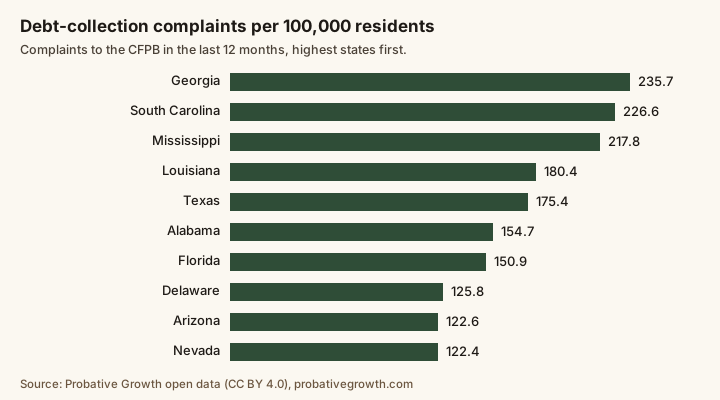
- The highest debt-collection rates are in Georgia (235.7), South Carolina (226.6) and Mississippi (217.8) per 100,000 residents. The lowest are Puerto Rico (10.8), Vermont (12.3) and Maine (13.6). The top rate is 21.8 times the bottom one.
- Nationwide, debt-collection complaints are up 28.6% on the 12 months before (252,028 from October 2024 to September 2025). 47 of 52 places filed more than a year earlier.
- The most common debt-collection issue is “Attempts to collect debt not owed”, at 43.3% of complaints. “Took or threatened to take negative or legal action” follows at 24.6% and “Written notification about debt” follows at 16.1%.
- Fastest growth among places with at least 500 complaints: Mississippi (+152.1%), South Carolina (+118.8%) and Washington (+115.7%).
- Biggest falls among them: West Virginia (−38.6%), Arkansas (−12.9%) and Missouri (−11.5%).
- Companies answered 96.5% of debt-collection complaints on time nationwide. The lowest on-time shares, among places with at least 500 complaints, were in Idaho (92.9%), Oklahoma (94.6%) and Minnesota (94.7%).
- Credit reporting is a different scale. People filed 6,366,110 credit-reporting and credit-repair complaints in the same 12 months, 1,863 per 100,000 residents; debt-management complaints came to 4,379.
Debt-collection complaints each month, nationwide, since 2018
Debt-collection complaints per calendar year: 2018 51,078, 2019 46,333, 2020 53,868, 2021 70,300, 2022 59,438, 2023 68,107, 2024 155,894, 2025 283,203. The latest months can still rise.
Credit-reporting and credit-repair complaints each month, nationwide, since 2018
Credit-reporting complaints per calendar year: 2018 111,596, 2019 138,556, 2020 283,715, 2021 307,538, 2022 604,181, 2023 1,046,868, 2024 2,365,586, 2025 4,810,292. The latest months can still rise.
Which places have the most debt-collection complaints per person?
Complaints received from October 2025 to September 2026, ranked by rate per 100,000 residents. Territories without a Census 2025 estimate are listed last by count. Rates for small places can move on a few filers.
| Place | Rank | Complaints | Per 100,000 | Change on prior 12 months | Answered on time | Most common issue |
|---|---|---|---|---|---|---|
| Georgia | 1 | 26,635 | 235.7 | +24.8% | 96.3% | Attempts to collect debt not owed (48.0%) |
| South Carolina | 2 | 12,620 | 226.6 | +118.8% | 96.9% | Attempts to collect debt not owed (63.5%) |
| Mississippi | 3 | 6,435 | 217.8 | +152.1% | 96.0% | Attempts to collect debt not owed (60.9%) |
| Louisiana | 4 | 8,333 | 180.4 | +47.5% | 96.4% | Attempts to collect debt not owed (44.7%) |
| Texas | 5 | 55,613 | 175.4 | +14.5% | 95.6% | Took or threatened to take negative or legal action (35.3%) |
| Alabama | 6 | 8,033 | 154.7 | +56.5% | 97.7% | Attempts to collect debt not owed (58.8%) |
| Florida | 7 | 35,402 | 150.9 | +26.9% | 97.1% | Attempts to collect debt not owed (47.8%) |
| Delaware | 8 | 1,333 | 125.8 | +17.2% | 97.7% | Attempts to collect debt not owed (50.1%) |
| Arizona | 9 | 9,344 | 122.6 | +114.3% | 94.9% | Took or threatened to take negative or legal action (55.9%) |
| Nevada | 10 | 4,016 | 122.4 | +32.6% | 97.0% | Attempts to collect debt not owed (44.9%) |
| North Carolina | 11 | 13,144 | 117.4 | +39.1% | 95.0% | Attempts to collect debt not owed (42.0%) |
| Maryland | 12 | 6,446 | 102.9 | +14.7% | 97.3% | Attempts to collect debt not owed (38.7%) |
| District of Columbia | 13 | 655 | 94.4 | +0.6% | 97.6% | Attempts to collect debt not owed (39.5%) |
| Illinois | 14 | 10,972 | 86.3 | +11.8% | 97.8% | Attempts to collect debt not owed (49.5%) |
| Pennsylvania | 15 | 10,861 | 83.2 | +20.4% | 97.8% | Attempts to collect debt not owed (51.7%) |
Show the other 41 places
| Place | Rank | Complaints | Per 100,000 | Change on prior 12 months | Answered on time | Most common issue |
|---|---|---|---|---|---|---|
| New Jersey | 16 | 7,908 | 82.8 | +32.0% | 97.0% | Attempts to collect debt not owed (47.6%) |
| Tennessee | 17 | 5,768 | 78.9 | +18.2% | 96.1% | Attempts to collect debt not owed (45.5%) |
| Arkansas | 18 | 2,307 | 74.1 | −12.9% | 96.5% | Attempts to collect debt not owed (44.2%) |
| Virginia | 19 | 6,466 | 72.8 | +5.8% | 97.0% | Attempts to collect debt not owed (43.4%) |
| California | 20 | 27,896 | 70.9 | +44.6% | 97.0% | Attempts to collect debt not owed (40.4%) |
| Oklahoma | 21 | 2,776 | 67.3 | +73.3% | 94.6% | Took or threatened to take negative or legal action (40.3%) |
| Michigan | 22 | 6,604 | 65.2 | +2.5% | 97.3% | Attempts to collect debt not owed (43.0%) |
| Rhode Island | 23 | 713 | 64.0 | +34.0% | 98.2% | Attempts to collect debt not owed (48.1%) |
| New York | 24 | 11,927 | 59.6 | +17.0% | 97.0% | Attempts to collect debt not owed (43.6%) |
| Ohio | 25 | 7,023 | 59.0 | +15.2% | 96.7% | Attempts to collect debt not owed (44.5%) |
| Missouri | 26 | 3,672 | 58.6 | −11.5% | 97.2% | Attempts to collect debt not owed (43.1%) |
| Washington | 27 | 4,434 | 55.4 | +115.7% | 96.9% | Written notification about debt (39.8%) |
| Indiana | 28 | 3,857 | 55.3 | +11.2% | 96.4% | Attempts to collect debt not owed (44.5%) |
| Connecticut | 29 | 2,024 | 54.9 | +4.1% | 96.4% | Attempts to collect debt not owed (38.5%) |
| North Dakota | 30 | 420 | 52.5 | +70.0% | 88.1% | Took or threatened to take negative or legal action (59.3%) |
| Massachusetts | 31 | 2,984 | 41.7 | +35.3% | 97.3% | Attempts to collect debt not owed (54.0%) |
| Colorado | 32 | 2,399 | 39.9 | +36.1% | 95.7% | Attempts to collect debt not owed (41.4%) |
| Wisconsin | 33 | 2,160 | 36.2 | +31.9% | 96.2% | Attempts to collect debt not owed (36.9%) |
| New Mexico | 34 | 765 | 36.0 | +35.9% | 96.6% | Attempts to collect debt not owed (39.2%) |
| Kentucky | 35 | 1,649 | 35.8 | +25.5% | 95.8% | Attempts to collect debt not owed (35.5%) |
| Minnesota | 36 | 2,057 | 35.3 | +30.0% | 94.7% | Attempts to collect debt not owed (33.5%) |
| Oregon | 37 | 1,496 | 35.0 | +57.3% | 97.5% | Attempts to collect debt not owed (34.3%) |
| Alaska | 38 | 251 | 34.0 | +57.9% | 87.3% | Attempts to collect debt not owed (38.2%) |
| Idaho | 39 | 621 | 30.6 | +55.2% | 92.9% | Attempts to collect debt not owed (30.8%) |
| Nebraska | 40 | 593 | 29.4 | −5.7% | 96.3% | Attempts to collect debt not owed (47.9%) |
| New Hampshire | 41 | 412 | 29.1 | +57.9% | 95.9% | Attempts to collect debt not owed (30.1%) |
| Wyoming | 42 | 171 | 29.0 | +33.6% | 94.7% | Attempts to collect debt not owed (29.2%) |
| West Virginia | 43 | 506 | 28.6 | −38.6% | 97.4% | Written notification about debt (35.4%) |
| Utah | 44 | 991 | 28.0 | +20.4% | 95.6% | Attempts to collect debt not owed (44.5%) |
| Kansas | 45 | 827 | 27.8 | −4.3% | 95.6% | Attempts to collect debt not owed (40.9%) |
| Hawaii | 46 | 396 | 27.6 | +34.2% | 94.9% | Attempts to collect debt not owed (41.9%) |
| Montana | 47 | 272 | 23.8 | +95.7% | 94.9% | Attempts to collect debt not owed (46.0%) |
| Iowa | 48 | 754 | 23.3 | +24.2% | 95.4% | Attempts to collect debt not owed (41.2%) |
| South Dakota | 49 | 197 | 21.1 | +80.7% | 95.4% | Took or threatened to take negative or legal action (26.9%) |
| Maine | 50 | 193 | 13.6 | +8.4% | 92.7% | Attempts to collect debt not owed (42.0%) |
| Vermont | 51 | 79 | 12.3 | +49.1% | 97.5% | Written notification about debt (26.6%) |
| Puerto Rico | 52 | 345 | 10.8 | +66.7% | 93.0% | Attempts to collect debt not owed (44.6%) |
| U.S. Virgin Islands | Not ranked | 30 | No Census estimate | −38.8% | 96.7% | Attempts to collect debt not owed (36.7%) |
| Guam | Not ranked | 11 | No Census estimate | +120.0% | 90.9% | Written notification about debt (45.5%) |
| Northern Mariana Islands | Not ranked | 7 | No Census estimate | +600.0% | 71.4% | Attempts to collect debt not owed (100.0%) |
| American Samoa | Not ranked | 6 | No Census estimate | n/a | 83.3% | Attempts to collect debt not owed (100.0%) |
Nationwide: 324,224 complaints, 94.9 per 100,000 residents, +28.6% on the 12 months before.
What about credit reporting and debt management?
The same table for the other two product groups, by state, October 2025 to September 2026. Credit-reporting complaints are far more numerous than the other two groups put together.
Credit reporting and credit repair, by state
| Place | Rank | Complaints | Per 100,000 | Change on prior 12 months | Answered on time | Most common issue |
|---|---|---|---|---|---|---|
| Mississippi | 1 | 176,428 | 5,972.2 | +152.0% | 99.9% | Incorrect information on your report (70.4%) |
| Georgia | 2 | 476,433 | 4,215.2 | +41.4% | 99.9% | Incorrect information on your report (58.9%) |
| Florida | 3 | 925,936 | 3,946.4 | +43.8% | 99.9% | Incorrect information on your report (62.7%) |
| Alabama | 4 | 195,047 | 3,755.9 | +76.1% | 99.9% | Incorrect information on your report (54.7%) |
| Louisiana | 5 | 166,783 | 3,611.4 | +68.2% | 99.9% | Incorrect information on your report (60.8%) |
| Texas | 6 | 1,046,329 | 3,299.7 | +78.1% | 99.9% | Incorrect information on your report (58.7%) |
| South Carolina | 7 | 167,947 | 3,015.1 | +80.6% | 99.9% | Incorrect information on your report (58.2%) |
| District of Columbia | 8 | 17,224 | 2,483.1 | +24.3% | 99.8% | Incorrect information on your report (55.9%) |
| Maryland | 9 | 140,805 | 2,247.4 | +30.4% | 99.9% | Incorrect information on your report (57.5%) |
| Nevada | 10 | 73,698 | 2,245.4 | +34.7% | 99.9% | Incorrect information on your report (56.2%) |
| Delaware | 11 | 22,868 | 2,157.5 | +19.5% | 99.9% | Incorrect information on your report (59.8%) |
| Illinois | 12 | 274,111 | 2,155.1 | +50.2% | 99.8% | Incorrect information on your report (53.8%) |
| North Carolina | 13 | 226,756 | 2,025.0 | +52.0% | 99.9% | Incorrect information on your report (56.4%) |
| New Jersey | 14 | 181,778 | 1,903.8 | +28.8% | 99.9% | Incorrect information on your report (63.2%) |
| Arkansas | 15 | 50,290 | 1,614.6 | +92.7% | 99.9% | Incorrect information on your report (59.7%) |
| New York | 16 | 319,471 | 1,597.2 | +28.0% | 99.9% | Incorrect information on your report (62.0%) |
| Pennsylvania | 17 | 205,776 | 1,575.7 | +30.6% | 99.9% | Incorrect information on your report (63.3%) |
| California | 18 | 574,174 | 1,458.9 | +47.1% | 99.9% | Incorrect information on your report (58.1%) |
| Rhode Island | 19 | 14,446 | 1,296.2 | +41.0% | 100.0% | Incorrect information on your report (61.4%) |
| Arizona | 20 | 95,699 | 1,255.3 | +51.0% | 99.9% | Incorrect information on your report (57.6%) |
| Michigan | 21 | 120,367 | 1,188.5 | +30.1% | 99.9% | Incorrect information on your report (56.5%) |
| Tennessee | 22 | 86,147 | 1,177.7 | +41.0% | 99.8% | Incorrect information on your report (60.7%) |
| Virginia | 23 | 103,869 | 1,169.7 | +35.5% | 99.9% | Incorrect information on your report (58.1%) |
| Massachusetts | 24 | 75,732 | 1,058.6 | +44.6% | 99.9% | Incorrect information on your report (61.3%) |
| Connecticut | 25 | 38,451 | 1,042.5 | +37.5% | 99.9% | Incorrect information on your report (58.0%) |
| Missouri | 26 | 63,983 | 1,020.4 | +46.7% | 99.9% | Incorrect information on your report (59.4%) |
| Ohio | 27 | 112,817 | 948.0 | +32.3% | 99.9% | Incorrect information on your report (58.7%) |
| Indiana | 28 | 61,582 | 883.1 | +26.2% | 99.8% | Incorrect information on your report (55.7%) |
| Puerto Rico | 29 | 27,004 | 847.9 | +28.6% | 100.0% | Incorrect information on your report (76.4%) |
| Wisconsin | 30 | 50,228 | 840.9 | +88.8% | 99.9% | Incorrect information on your report (67.5%) |
| Hawaii | 31 | 11,162 | 779.0 | +99.8% | 99.9% | Incorrect information on your report (64.9%) |
| Washington | 32 | 56,407 | 705.0 | +117.1% | 99.9% | Incorrect information on your report (64.0%) |
| Oklahoma | 33 | 25,156 | 610.1 | +59.2% | 99.9% | Incorrect information on your report (57.4%) |
| Colorado | 34 | 33,122 | 550.9 | +44.6% | 99.9% | Incorrect information on your report (55.5%) |
| Kentucky | 35 | 22,476 | 487.9 | +41.8% | 99.8% | Incorrect information on your report (51.7%) |
| New Mexico | 36 | 9,672 | 455.0 | +63.2% | 99.9% | Incorrect information on your report (55.0%) |
| North Dakota | 37 | 3,405 | 426.0 | +68.1% | 99.8% | Incorrect information on your report (54.3%) |
| Utah | 38 | 14,979 | 423.3 | +51.6% | 99.8% | Incorrect information on your report (61.2%) |
| Kansas | 39 | 12,440 | 417.8 | +45.3% | 99.9% | Incorrect information on your report (61.0%) |
| Nebraska | 40 | 8,223 | 407.5 | +39.9% | 99.9% | Incorrect information on your report (58.4%) |
| Minnesota | 41 | 22,463 | 385.3 | +30.5% | 99.9% | Incorrect information on your report (54.7%) |
| Alaska | 42 | 2,646 | 358.9 | +43.6% | 99.9% | Incorrect information on your report (66.1%) |
| Oregon | 43 | 12,855 | 300.8 | +63.3% | 99.8% | Incorrect information on your report (58.6%) |
| Iowa | 44 | 9,572 | 295.6 | +38.9% | 99.8% | Incorrect information on your report (60.8%) |
| New Hampshire | 45 | 4,030 | 284.7 | +14.5% | 99.8% | Incorrect information on your report (52.6%) |
| West Virginia | 46 | 5,006 | 283.4 | +44.9% | 99.8% | Incorrect information on your report (59.9%) |
| Idaho | 47 | 4,342 | 213.9 | +51.7% | 99.8% | Incorrect information on your report (56.9%) |
| Maine | 48 | 2,813 | 198.8 | +73.2% | 99.8% | Incorrect information on your report (43.7%) |
| Montana | 49 | 2,069 | 180.7 | +65.7% | 99.5% | Incorrect information on your report (60.1%) |
| South Dakota | 50 | 1,614 | 172.6 | +53.0% | 99.8% | Incorrect information on your report (55.3%) |
| Wyoming | 51 | 978 | 166.1 | +38.9% | 99.4% | Incorrect information on your report (54.1%) |
| Vermont | 52 | 785 | 121.8 | +3.4% | 100.0% | Incorrect information on your report (50.7%) |
| U.S. Virgin Islands | Not ranked | 2,067 | No Census estimate | +52.3% | 99.8% | Incorrect information on your report (84.0%) |
| American Samoa | Not ranked | 255 | No Census estimate | +553.8% | 100.0% | Incorrect information on your report (81.6%) |
| Guam | Not ranked | 70 | No Census estimate | −32.0% | 100.0% | Incorrect information on your report (77.1%) |
| Northern Mariana Islands | Not ranked | 35 | No Census estimate | +218.2% | 100.0% | Incorrect information on your report (91.4%) |
Debt or credit management, by state
| Place | Rank | Complaints | Per 100,000 | Change on prior 12 months | Answered on time | Most common issue |
|---|---|---|---|---|---|---|
| Florida | 1 | 620 | 2.6 | +52.0% | 93.9% | Confusing or missing disclosures (43.1%) |
| Mississippi | 2 | 68 | 2.3 | −13.9% | 95.6% | Confusing or missing disclosures (33.8%) |
| Georgia | 3 | 242 | 2.1 | −16.3% | 92.6% | Confusing or missing disclosures (27.7%) |
| Wisconsin | 4 | 113 | 1.9 | +135.4% | 95.6% | Confusing or missing disclosures (67.3%) |
| Louisiana | 5 | 77 | 1.7 | +6.9% | 92.2% | Charged upfront or unexpected fees (26.0%) |
| Nevada | 6 | 56 | 1.7 | −3.4% | 89.3% | Confusing or misleading advertising or marketing (23.2%) |
| Texas | 7 | 482 | 1.5 | +2.3% | 89.2% | Confusing or missing disclosures (28.0%) |
| Connecticut | 8 | 51 | 1.4 | +64.5% | 86.3% | Didn't provide services promised (35.3%) |
| Delaware | 9 | 15 | 1.4 | +15.4% | 100.0% | Didn't provide services promised (46.7%) |
| Maryland | 10 | 85 | 1.4 | −14.1% | 89.4% | Didn't provide services promised (23.5%) |
| Tennessee | 11 | 102 | 1.4 | +7.4% | 91.2% | Confusing or missing disclosures (43.1%) |
| Arkansas | 12 | 39 | 1.3 | −7.1% | 89.7% | Charged upfront or unexpected fees (30.8%) |
| Massachusetts | 13 | 92 | 1.3 | 0.0% | 90.2% | Confusing or missing disclosures (39.1%) |
| Missouri | 14 | 80 | 1.3 | +19.4% | 80.0% | Confusing or missing disclosures (28.8%) |
| Oklahoma | 15 | 53 | 1.3 | +29.3% | 90.6% | Didn't provide services promised (24.5%) |
| Virginia | 16 | 113 | 1.3 | +22.8% | 93.8% | Didn't provide services promised (28.3%) |
| California | 17 | 478 | 1.2 | +33.1% | 90.8% | Confusing or missing disclosures (27.4%) |
| Colorado | 18 | 74 | 1.2 | +54.2% | 87.8% | Didn't provide services promised (33.8%) |
| South Carolina | 19 | 68 | 1.2 | −58.5% | 95.6% | Charged upfront or unexpected fees (23.5%) |
| Arizona | 20 | 83 | 1.1 | +2.5% | 88.0% | Didn't provide services promised (25.3%) |
| Michigan | 21 | 113 | 1.1 | −19.9% | 88.5% | Didn't provide services promised (25.7%) |
| New Jersey | 22 | 106 | 1.1 | −13.1% | 87.7% | Didn't provide services promised (24.5%) |
| North Carolina | 23 | 128 | 1.1 | −14.1% | 94.5% | Didn't provide services promised (28.9%) |
| North Dakota | 24 | 9 | 1.1 | +800.0% | 100.0% | Confusing or missing disclosures (77.8%) |
| Pennsylvania | 25 | 143 | 1.1 | −19.2% | 91.6% | Didn't provide services promised (33.6%) |
| District of Columbia | 26 | 7 | 1.0 | −36.4% | 100.0% | Confusing or misleading advertising or marketing (28.6%) |
| Montana | 27 | 12 | 1.0 | +140.0% | 66.7% | Didn't provide services promised (50.0%) |
| New York | 28 | 207 | 1.0 | +1.0% | 89.4% | Didn't provide services promised (32.9%) |
| Illinois | 29 | 116 | 0.9 | −18.9% | 89.7% | Didn't provide services promised (24.1%) |
| Ohio | 30 | 103 | 0.9 | −13.4% | 93.2% | Problem with customer service (19.4%) |
| Alabama | 31 | 44 | 0.8 | −53.2% | 90.9% | Didn't provide services promised (22.7%) |
| Hawaii | 32 | 11 | 0.8 | +83.3% | 81.8% | Didn't provide services promised (54.5%) |
| Minnesota | 33 | 44 | 0.8 | +51.7% | 90.9% | Confusing or missing disclosures (36.4%) |
| Utah | 34 | 29 | 0.8 | −35.6% | 93.1% | Confusing or missing disclosures (41.4%) |
| Alaska | 35 | 5 | 0.7 | −37.5% | 100.0% | Problem with customer service (40.0%) |
| Idaho | 36 | 14 | 0.7 | +133.3% | 57.1% | Didn't provide services promised (28.6%) |
| Indiana | 37 | 52 | 0.7 | −1.9% | 92.3% | Didn't provide services promised (38.5%) |
| New Hampshire | 38 | 10 | 0.7 | +66.7% | 100.0% | Didn't provide services promised (50.0%) |
| New Mexico | 39 | 14 | 0.7 | −6.7% | 100.0% | Confusing or misleading advertising or marketing (21.4%) |
| Washington | 40 | 53 | 0.7 | +3.9% | 94.3% | Didn't provide services promised (32.1%) |
| West Virginia | 41 | 13 | 0.7 | +160.0% | 84.6% | Didn't provide services promised (53.8%) |
| Wyoming | 42 | 4 | 0.7 | +100.0% | 75.0% | Charged upfront or unexpected fees (50.0%) |
| Kansas | 43 | 17 | 0.6 | +21.4% | 100.0% | Didn't provide services promised (41.2%) |
| Kentucky | 44 | 27 | 0.6 | −32.5% | 88.9% | Confusing or missing disclosures (22.2%) |
| Maine | 45 | 9 | 0.6 | +800.0% | 66.7% | Didn't provide services promised (44.4%) |
| Oregon | 46 | 26 | 0.6 | +52.9% | 84.6% | Didn't provide services promised (38.5%) |
| Vermont | 47 | 4 | 0.6 | +100.0% | 50.0% | Confusing or misleading advertising or marketing (25.0%) |
| Nebraska | 48 | 11 | 0.5 | +57.1% | 100.0% | Confusing or missing disclosures (27.3%) |
| Rhode Island | 49 | 6 | 0.5 | −53.8% | 83.3% | Didn't provide services promised (50.0%) |
| South Dakota | 50 | 5 | 0.5 | −37.5% | 100.0% | Didn't provide services promised (60.0%) |
| Iowa | 51 | 14 | 0.4 | 0.0% | 100.0% | Confusing or missing disclosures (42.9%) |
| Puerto Rico | 52 | 9 | 0.3 | +50.0% | 88.9% | Problem with customer service (33.3%) |
| Guam | Not ranked | 1 | No Census estimate | 0.0% | 0.0% | Confusing or missing disclosures (100.0%) |
| American Samoa | Not ranked | 0 | No Census estimate | n/a | n/a | n/a |
| Northern Mariana Islands | Not ranked | 0 | No Census estimate | n/a | n/a | n/a |
| U.S. Virgin Islands | Not ranked | 0 | No Census estimate | n/a | n/a | n/a |
How did we build it?
We ask the CFPB’s own Consumer Complaint Database search API for counts only, by state, month, product and issue, waiting more than a second between requests. We never request a complaint row, a narrative, a company name or a ZIP code. For 105 months, January 2018 to September 2026, the issue counts add up to the bureau’s count for each product group, and the state counts add up to its own state counts. A month that does not add up is not published. Rates divide by the Census Bureau’s 2025 state population estimates.
- A complaint is a report, not a finding. The bureau does not verify what a consumer says, and the database is not a statistical sample of consumers’ experiences.
- Product names changed. The bureau has used three names for credit reporting since 2017, and a debt-management product appears from 2022. We combine each group’s names so the series has no break at a rename.
- The newest months can still rise. A complaint is published after the company responds, up to 15 days after it is received, so we re-read the latest three months each time.
- Some complaints give no state, or a military or island address. They count nationwide and in the CSV (as “State not given” and “Other places”), not in any state’s rate.
- Counts only. No company is named anywhere in this data.
- Not legal advice, and not a list of people to contact.
The full series has every state, product group and issue by month: the file list and one CSV per year, plus the bureau’s own monthly totals.
How to cite this study
You can reuse, adapt and republish this data, including commercially, under the Creative Commons Attribution 4.0 license (CC BY 4.0). The only condition is that you credit Probative and link to the source.
- Version
- 1.0.0, released October 27, 2026
- Every version
- 10.5281/zenodo.23733730 (always points to the newest)
- License
- CC BY 4.0
Download the data
- CSV: data.csv 18 KB · by state and product group, 12 months to September 2026
- CSV: complaints-2018.csv 479 KB · every state, product group and issue by month in 2018
- CSV: complaints-2019.csv 488 KB · every state, product group and issue by month in 2019
- CSV: complaints-2020.csv 486 KB · every state, product group and issue by month in 2020
- CSV: complaints-2021.csv 496 KB · every state, product group and issue by month in 2021
- CSV: complaints-2022.csv 529 KB · every state, product group and issue by month in 2022
- CSV: complaints-2023.csv 576 KB · every state, product group and issue by month in 2023
- CSV: complaints-2024.csv 638 KB · every state, product group and issue by month in 2024
- CSV: complaints-2025.csv 708 KB · every state, product group and issue by month in 2025
- CSV: complaints-2026.csv 540 KB · every state, product group and issue by month in 2026
- CSV: monthly-totals.csv 17 KB · the CFPB-side count for every month and product group
- CSV: state-outcomes.csv 23 KB · on-time and company-response counts by state
Free, no email or login. The files are hosted on this site and Zenodo, a public research archive.
Suggested citation
Probative. (2026). CFPB complaints about debt collection, credit reporting and debt management, by state and month (Version 1.0.0) [Data set]. Zenodo. https://doi.org/10.5281/zenodo.23733731
Credit line for a chart, table or article
Source: Probative, CFPB complaints about debt collection, credit reporting and debt management, by state and month, version 1.0.0, https://doi.org/10.5281/zenodo.23733731, licensed CC BY 4.0.
Not legal advice. These are counts of complaints consumers filed with the CFPB, kept for marketing planning. A complaint is a report, not a finding that anyone broke a law.
Where can I read more?
- The bureau’s own page: the CFPB Consumer Complaint Database.
- Each state’s lawyer ad rules: our state rules library and the plain-English guide.
- Fee caps on injury, malpractice and federal claims: attorney fee caps by state.
- Where cases are pending: the federal MDL tracker.
Questions about CFPB complaint data
How many debt-collection complaints are filed with the CFPB?
324,224 in the 12 months to September 2026, or 94.9 per 100,000 residents. The 12 months before that had 252,028.
Which state has the most debt-collection complaints per person?
Georgia, with 235.7 per 100,000 residents in the 12 months to September 2026. Next are South Carolina (226.6) and Mississippi (217.8). Rates are complaints divided by the Census Bureau’s 2025 population estimate for each place.
Does a high complaint rate mean a state has more illegal debt collection?
No. A complaint is a consumer’s own report, and the CFPB does not verify it. A high rate can reflect more debt in collection, more people who know where to complain, or one filer’s repeated reports. Use it to see where people are reporting problems, not to judge anyone.
Which products are counted?
Three groups. Debt collection. Credit reporting and credit repair, which the CFPB has filed under three product names since 2017 and we combine. And debt or credit management. Every complaint is counted once, under the product the consumer picked.
Do you publish company names?
No. The data holds counts by state, month, product and issue only. No company name, complaint narrative or ZIP code is requested, stored or published.
How often is it updated?
Monthly. The CFPB publishes a complaint after the company responds, up to 15 days after it is received, so the newest months can still rise; we re-read the latest three months each time. This version runs through September 2026.
Can I reuse this consumer-complaint data?
Yes. It is free under CC BY 4.0. Credit Probative with a link to this page. The full monthly series is free to download too.
Free
Want your ads checked?
We look at your ads, Google profile and website against your state’s rules, and show you where you stand in Google and AI answers. It’s free.
Not sure where to start? Answer 7 questions Ready to talk? Talk to us Or see what AI says about your firm
Your free review: It covers your Google listing, website, phone and ads, from public information.