
Research
Fatal crashes by county: trucks, motorcycles, pedestrians and bicyclists
In 2024, 36,297 fatal crashes on U.S. roads killed 39,254 people, according to the National Highway Traffic Safety Administration's Fatality Analysis Reporting System. The 2024 figures come from NHTSA's first release, the annual report file, and can change when the final file comes out; 2019 through 2023 are final.
Key facts
- Fatal crashes in 2024
- 36,297
- in 3,143 counties
- People killed
- 39,254
- 11.55 per 100,000 residents
- Crashes with a large truck
- 4,825
- 5,396 people killed in them
- Pedestrians killed
- 7,080
- +12.9% since 2019
- Bicyclists killed
- 1,075
- +25.6% since 2019
- Motorcyclists killed
- 6,225
- +23.4% since 2019
Download every county and year (CSV) Look up one county Free under CC BY 4.0. No email or login.
What does the count measure?
Every year the National Highway Traffic Safety Administration (NHTSA) records each crash on a public road in which someone died within 30 days, in a file called the Fatality Analysis Reporting System (FARS). We count those crashes by the county where they happened, and split them by the vehicles and people involved. It is a count of deaths and crashes, not of injuries, claims or fault.
What did we find?
- The 25 counties with the most fatal crashes had 17.9% of all fatal crashes in 2024, led by Los Angeles County (CA), Maricopa County (AZ) and Harris County (TX).
- Fatal crashes involving a large truck numbered 4,825 in 2024, up 7.2% from 4,500 in 2019.
- The 25 counties with the most of them held 12.6% of the large-truck fatal crashes in 2024.
- Counties where half or more of residents live in rural areas had 21.0 deaths per 100,000 residents in 2024, against 10.2 in the other counties, or 2.1 times as many.
- Pedestrian deaths were 7,080 in 2024, up 12.9% from 6,272 in 2019.
- Bicyclist deaths were 1,075 in 2024, up 25.6% from 856 in 2019.
- Motorcyclist deaths were 6,225 in 2024, up 23.4% from 5,044 in 2019.
- The 2024 figures come from NHTSA's first release, the annual report file, and can change when the final file comes out; 2019 through 2023 are final.
How have fatal crashes changed since 2019?
- All fatal crashes
- Crashes with a large truck
- Pedestrians killed
- Motorcyclists killed
- Bicyclists killed
Fatal crashes and deaths by road user, indexed so that 2019 is 100: by 2024, pedestrians killed stand at 113, motorcyclists at 123, bicyclists at 126, crashes with a large truck at 107 and all fatal crashes at 108.
The numbers behind the chart (every year)
| Year | Fatal crashes | People killed | Crashes with a large truck | Pedestrians killed | Bicyclists killed | Motorcyclists killed | File |
|---|---|---|---|---|---|---|---|
| 2019 | 33,487 | 36,355 | 4,500 | 6,272 | 856 | 5,044 | final |
| 2020 | 35,935 | 39,007 | 4,463 | 6,565 | 942 | 5,617 | final |
| 2021 | 39,785 | 43,230 | 5,229 | 7,470 | 971 | 6,137 | final |
| 2022 | 39,422 | 42,721 | 5,349 | 7,593 | 1,096 | 6,251 | final |
| 2023 | 37,769 | 41,025 | 4,958 | 7,367 | 1,163 | 6,367 | final |
| 2024 | 36,297 | 39,254 | 4,825 | 7,080 | 1,075 | 6,225 | annual report file |
Which 25 counties had the most fatal crashes involving a large truck in 2024?
A crash counts once if any vehicle in it was a truck over 10,000 pounds. The list is ranked by count, so the biggest counties lead; the last column is the same count in 2019.
| County | Large-truck crashes 2024 | All fatal crashes | Share with a large truck | Large-truck crashes 2019 |
|---|---|---|---|---|
| Los Angeles County, CA | 61 | 726 | 8.4% | 60 |
| Maricopa County, AZ | 42 | 560 | 7.5% | 27 |
| Harris County, TX | 41 | 551 | 7.4% | 36 |
| Dallas County, TX | 34 | 304 | 11.2% | 23 |
| San Bernardino County, CA | 33 | 310 | 10.6% | 40 |
| Riverside County, CA | 27 | 275 | 9.8% | 28 |
| Polk County, FL | 26 | 107 | 24.3% | 20 |
| Palm Beach County, FL | 25 | 191 | 13.1% | 17 |
| Kern County, CA | 23 | 173 | 13.3% | 26 |
| Shelby County, TN | 23 | 195 | 11.8% | 16 |
| Orange County, FL | 22 | 152 | 14.5% | 17 |
| San Joaquin County, CA | 21 | 123 | 17.1% | 14 |
| Bexar County, TX | 21 | 208 | 10.1% | 15 |
| Fresno County, CA | 20 | 150 | 13.3% | 11 |
| San Diego County, CA | 20 | 282 | 7.1% | 17 |
| Cook County, IL | 20 | 333 | 6% | 29 |
| Tarrant County, TX | 20 | 193 | 10.4% | 17 |
| Clark County, NV | 19 | 267 | 7.1% | 17 |
| Weld County, CO | 17 | 62 | 27.4% | 18 |
| Lee County, FL | 16 | 113 | 14.2% | 12 |
| Miami-Dade County, FL | 16 | 265 | 6% | 23 |
| Broward County, FL | 15 | 229 | 6.6% | 16 |
| Marion County, IN | 15 | 125 | 12% | 10 |
| Wayne County, MI | 15 | 166 | 9% | 11 |
| Travis County, TX | 15 | 137 | 10.9% | 19 |
A truck in the crash does not mean the truck caused it: the count says nothing about fault. 318 of 3,143 counties had no fatal crash at all in 2024.
Where were pedestrians, bicyclists and motorcyclists killed in 2024?
The ten counties with the most deaths in each group, with the same count in 2019. These are people killed, not crashes.
| County | 2024 | 2019 |
|---|---|---|
| Los Angeles County, CA | 316 | 280 |
| Harris County, TX | 170 | 119 |
| Maricopa County, AZ | 148 | 125 |
| Cook County, IL | 107 | 103 |
| San Diego County, CA | 97 | 87 |
| Dallas County, TX | 97 | 83 |
| San Bernardino County, CA | 93 | 81 |
| Clark County, NV | 92 | 43 |
| Miami-Dade County, FL | 77 | 90 |
| Riverside County, CA | 71 | 68 |
| County | 2024 | 2019 |
|---|---|---|
| Maricopa County, AZ | 26 | 19 |
| Los Angeles County, CA | 26 | 38 |
| Broward County, FL | 20 | 13 |
| Miami-Dade County, FL | 20 | 16 |
| Harris County, TX | 17 | 20 |
| Hillsborough County, FL | 15 | 11 |
| Cook County, IL | 14 | 8 |
| Sacramento County, CA | 13 | 6 |
| Orange County, CA | 11 | 13 |
| San Diego County, CA | 11 | 8 |
| County | 2024 | 2019 |
|---|---|---|
| Maricopa County, AZ | 123 | 93 |
| Los Angeles County, CA | 89 | 100 |
| Harris County, TX | 83 | 61 |
| Miami-Dade County, FL | 82 | 52 |
| Clark County, NV | 68 | 35 |
| San Diego County, CA | 57 | 49 |
| Riverside County, CA | 51 | 39 |
| San Bernardino County, CA | 44 | 40 |
| Tarrant County, TX | 43 | 26 |
| Orange County, CA | 42 | 36 |
Rural and urban counties: deaths per 100,000 residents
The Census Bureau calls a county mostly rural when half or more of its 2020 residents live in rural areas. Rates use the Census population estimate for 2024; 8 Connecticut counties have no matching estimate and are left out of this table.
| County type | Counties | Residents | Fatal crashes | People killed | Deaths per 100,000 |
|---|---|---|---|---|---|
| Mostly rural | 1,884 | 42,937,408 | 8,177 | 9,010 | 21 |
| Mostly urban | 1,249 | 293,382,673 | 27,829 | 29,928 | 10.2 |
Seen from the road instead of the county: 40.2% of 2024 fatal crashes happened on roads NHTSA codes as rural.
The ten highest rates among counties of 100,000 or more residents
| County | People killed | Residents | Deaths per 100,000 |
|---|---|---|---|
| Coconino County, AZ | 64 | 144,658 | 44.24 |
| Robeson County, NC | 46 | 119,400 | 38.53 |
| Douglas County, OR | 37 | 112,351 | 32.93 |
| Navajo County, AZ | 35 | 109,563 | 31.95 |
| Ector County, TX | 50 | 170,654 | 29.3 |
| Hinds County, MS | 59 | 212,718 | 27.74 |
| Cochise County, AZ | 34 | 125,199 | 27.16 |
| Madison County, TN | 27 | 100,267 | 26.93 |
| LaSalle County, IL | 29 | 107,875 | 26.88 |
| Marion County, FL | 113 | 427,995 | 26.4 |
Every state
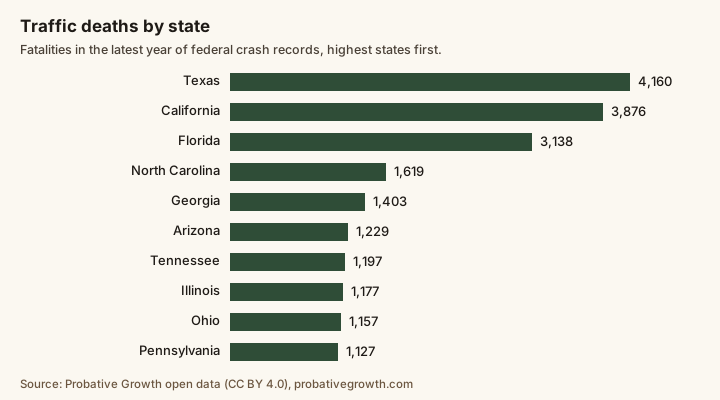
Fatal crashes by state and type, 2024 (50 states and DC)
| State | Fatal crashes | People killed | Deaths per 100,000 | Large-truck crashes | Pedestrians | Bicyclists | Motorcyclists | Data |
|---|---|---|---|---|---|---|---|---|
| Alabama | 895 | 962 | 18.63 | 130 | 128 | 10 | 127 | AL JSON |
| Alaska | 63 | 70 | 9.5 | 9 | 15 | 1 | 10 | AK JSON |
| Arizona | 1,118 | 1,229 | 16.26 | 122 | 250 | 43 | 219 | AZ JSON |
| Arkansas | 547 | 603 | 19.48 | 85 | 69 | 4 | 75 | AR JSON |
| California | 3,583 | 3,876 | 9.85 | 358 | 1,090 | 162 | 522 | CA JSON |
| Colorado | 642 | 689 | 11.51 | 90 | 112 | 14 | 165 | CO JSON |
| Connecticut | 285 | 310 | 8.44 | 29 | 61 | 4 | 75 | CT JSON |
| Delaware | 121 | 126 | 12 | 12 | 28 | 4 | 22 | DE JSON |
| District of Columbia | 46 | 47 | 6.8 | 1 | 18 | 1 | 8 | DC JSON |
| Florida | 2,931 | 3,138 | 13.49 | 325 | 668 | 201 | 642 | FL JSON |
| Georgia | 1,312 | 1,403 | 12.52 | 184 | 286 | 22 | 182 | GA JSON |
| Hawaii | 97 | 102 | 7.11 | 2 | 35 | 7 | 26 | HI JSON |
| Idaho | 219 | 238 | 11.89 | 43 | 14 | 3 | 47 | ID JSON |
| Illinois | 1,085 | 1,177 | 9.27 | 132 | 213 | 37 | 150 | IL JSON |
| Indiana | 785 | 832 | 12 | 135 | 104 | 18 | 137 | IN JSON |
| Iowa | 324 | 356 | 11.02 | 52 | 30 | 4 | 63 | IA JSON |
| Kansas | 314 | 339 | 11.43 | 58 | 34 | 7 | 56 | KS JSON |
| Kentucky | 663 | 707 | 15.42 | 79 | 95 | 11 | 118 | KY JSON |
| Louisiana | 705 | 752 | 16.3 | 87 | 159 | 43 | 70 | LA JSON |
| Maine | 167 | 177 | 12.57 | 28 | 13 | 1 | 35 | ME JSON |
| Maryland | 552 | 578 | 9.25 | 61 | 152 | 11 | 95 | MD JSON |
| Massachusetts | 349 | 363 | 5.09 | 29 | 76 | 10 | 70 | MA JSON |
| Michigan | 1,011 | 1,098 | 10.87 | 100 | 150 | 29 | 184 | MI JSON |
| Minnesota | 431 | 477 | 8.23 | 70 | 57 | 7 | 75 | MN JSON |
| Mississippi | 678 | 753 | 25.52 | 92 | 104 | 9 | 55 | MS JSON |
| Missouri | 882 | 955 | 15.3 | 126 | 137 | 18 | 145 | MO JSON |
| Montana | 193 | 206 | 18.11 | 30 | 10 | 2 | 38 | MT JSON |
| Nebraska | 223 | 251 | 12.52 | 55 | 19 | 4 | 32 | NE JSON |
| Nevada | 378 | 417 | 12.82 | 37 | 108 | 15 | 89 | NV JSON |
| New Hampshire | 120 | 133 | 9.44 | 13 | 10 | 4 | 35 | NH JSON |
| New Jersey | 638 | 670 | 7.05 | 62 | 210 | 24 | 112 | NJ JSON |
| New Mexico | 378 | 409 | 19.23 | 76 | 90 | 6 | 50 | NM JSON |
| New York | 1,036 | 1,101 | 5.5 | 118 | 289 | 46 | 209 | NY JSON |
| North Carolina | 1,509 | 1,619 | 14.65 | 191 | 264 | 36 | 212 | NC JSON |
| North Dakota | 84 | 90 | 11.34 | 23 | 5 | 1 | 17 | ND JSON |
| Ohio | 1,077 | 1,157 | 9.75 | 153 | 122 | 24 | 222 | OH JSON |
| Oklahoma | 594 | 645 | 15.74 | 100 | 77 | 11 | 106 | OK JSON |
| Oregon | 491 | 538 | 12.61 | 68 | 96 | 11 | 85 | OR JSON |
| Pennsylvania | 1,060 | 1,127 | 8.64 | 146 | 173 | 21 | 217 | PA JSON |
| Rhode Island | 48 | 52 | 4.68 | 4 | 13 | 4 | 8 | RI JSON |
| South Carolina | 948 | 1,038 | 18.91 | 125 | 156 | 34 | 154 | SC JSON |
| South Dakota | 134 | 146 | 15.75 | 30 | 9 | 4 | 33 | SD JSON |
| Tennessee | 1,093 | 1,197 | 16.51 | 158 | 158 | 9 | 188 | TN JSON |
| Texas | 3,774 | 4,160 | 13.28 | 647 | 763 | 79 | 582 | TX JSON |
| Utah | 251 | 277 | 7.91 | 42 | 42 | 8 | 53 | UT JSON |
| Vermont | 53 | 59 | 9.13 | 4 | 6 | 2 | 7 | VT JSON |
| Virginia | 867 | 917 | 10.4 | 111 | 123 | 24 | 122 | VA JSON |
| Washington | 674 | 730 | 9.21 | 69 | 152 | 12 | 113 | WA JSON |
| West Virginia | 238 | 256 | 14.48 | 35 | 25 | 4 | 38 | WV JSON |
| Wisconsin | 529 | 595 | 9.99 | 69 | 58 | 8 | 106 | WI JSON |
| Wyoming | 102 | 107 | 18.24 | 20 | 4 | 1 | 24 | WY JSON |
How do I look up my county?
Every county has its own small file with all 2019–2024 counts, found by its five-digit FIPS code (Harris County, Texas is 48201). Each state has one too, by its two-digit code (Texas is 48), and the whole country is US.
- One county (Harris County, TX shown)
/data/v1/fatal-crashes/areas/{fips}.json - Every county, state and the US, newest year (CSV)
- Every county and year, 2019-2024 (CSV)
- Ask an AI assistant: add
https://probativegrowth.com/mcp/fatal-crashesas an MCP connector (no sign-in); it finds a county by name or code. Setup for each app.
Embed a county card
Put one county’s fatal crashes by year on your own site or blog. Copy the code below and replace 48201 with your county’s FIPS code. It shows the card and a credit line under it that names the dataset and its DOI; the credit links are marked rel="nofollow", as Google asks for links given out in widgets. Preview the card.
Does your site remove iframes? Copy an image or a table instead
The image and the table show the study’s main chart, not one card. Each carries the same credit line.
How did we build it?
We downloaded NHTSA’s FARS national CSV file for each year from 2019 to 2024 from static.nhtsa.gov. A program counts the accident, vehicle and person tables by the county where each crash happened. A county-year is published only if the counties and the 14 crashes with no county code add up to each state and the states to the nation’s own total, checked again from the raw tables for every release. Population comes from the Census Bureau (Vintage 2025 for 2020 on, Vintage 2019 for 2019).
- Counts, not fault. A crash counts when someone died within 30 days. It says nothing about who caused it, insurance or claims.
- 2024 is preliminary. It is NHTSA’s first release. 2019 through 2023 are its final files. A new file is added each spring.
- Large truck means over 10,000 pounds. Single-unit trucks, tractor-trailers and heavy pickups, by NHTSA’s vehicle body type; buses and motor homes are not counted. Motorcycle means body types 80 to 89, which include mopeds and scooters.
- Crashes and people are counted separately. A crash with a pedestrian counts once however many people died in it; “pedestrians killed” counts people. A crash can be in more than one group.
- The county is where the crash happened, not where anyone lived. A few crashes have no county code and are counted in the state and the nation only. FARS still prints two old county codes in some years; we map them to the current counties (Oglala Lakota, SD and Kusilvak, AK).
- Rates need a population. Connecticut’s counties have no Census estimate after 2019 because the Bureau now publishes its planning regions, so their rates are blank. A rate from fewer than 10 crashes moves a lot with one crash; those counties are flagged in the data.
- Alcohol uses NHTSA’s own estimate. NHTSA fills in missing blood-alcohol tests with 10 statistical draws. We count a crash as the share of draws in which a driver was at 0.08 or more, summed and rounded, so alcohol totals can differ by a crash or two from the sum of the parts.
- Not legal advice, and not a list of people to contact. Nothing here names a person.
The same figures sit behind the crash numbers on our state practice pages. Personal injury marketing by state.
How to cite this study
You can reuse, adapt and republish this data, including commercially, under the Creative Commons Attribution 4.0 license (CC BY 4.0). The only condition is that you credit Probative and link to the source.
- Version
- 1.0.0, released October 28, 2026
- Every version
- 10.5281/zenodo.23733738 (always points to the newest)
- License
- CC BY 4.0
Download the data
- CSV: data.csv 2125 KB · one row per county and year, 2019 to 2024, plus states and the US (19,173 rows)
- JSON: fatal-crashes.json 9701 KB · one record per county, state and the US, with every year and its sources
Free, no email or login. The files are hosted on this site and Zenodo, a public research archive.
Suggested citation
Probative. (2026). Fatal crashes by county and type: trucks, motorcycles, pedestrians and bicyclists, NHTSA FARS 2019 to 2024 (Version 1.0.0) [Data set]. Zenodo. https://doi.org/10.5281/zenodo.23733739
Credit line for a chart, table or article
Source: Probative, Fatal crashes by county and type: trucks, motorcycles, pedestrians and bicyclists, NHTSA FARS 2019 to 2024, version 1.0.0, https://doi.org/10.5281/zenodo.23733739, licensed CC BY 4.0.
Not legal advice. These are counts from NHTSA's public crash census, kept for marketing planning. A county's count says nothing about who was at fault, and the newest year can change when NHTSA issues its final file.
Where can I read more?
- The source: NHTSA’s Fatality Analysis Reporting System.
- Each state’s lawyer ad rules: our state rules library.
- Fee caps on injury, malpractice and federal claims: Exhibit No. 2, attorney fee caps by state.
Questions about fatal crash counts
How many people die in car crashes in the US each year?
39,254 people died in 36,297 fatal crashes in 2024, down from 41,025 in 2023, according to the National Highway Traffic Safety Administration (NHTSA). The 2024 number is its first release and can change.
Which counties have the most fatal crashes?
In 2024: Los Angeles County, CA (726), Maricopa County, AZ (560), Harris County, TX (551), Cook County, IL (333), San Bernardino County, CA (310). Big counties lead on counts; for risk per resident, use the rate columns, which are ranked only for counties of 100,000 or more residents.
Which counties have the most fatal crashes involving large trucks?
In 2024: Los Angeles County, CA (61), Maricopa County, AZ (42), Harris County, TX (41), Dallas County, TX (34), San Bernardino County, CA (33). The table above lists the top 25.
What counts as a “large truck”?
A truck over 10,000 pounds gross vehicle weight: single-unit trucks, tractor-trailers and heavy pickups, by the vehicle body type NHTSA records. Buses, motor homes and vehicles of unknown type are not counted. A crash counts once if any vehicle in it was a large truck, whoever died.
Does this say who was at fault?
No. It counts crashes in which someone died within 30 days, by the county where the crash happened. It says nothing about fault, insurance or whether anyone has a claim.
Why is 2024 marked as preliminary?
NHTSA publishes each year twice: an annual report file first, then a final file about a year later. 2019 through 2023 are final; 2024 is the first release and can change.
Can I reuse this fatal-crash data?
Yes. The crash counts are a US government work and our table is free under CC BY 4.0. Credit Probative with a link to this page. The table has one row for every county and year.
Free
Want your ads checked?
We look at your ads, Google profile and website against your state’s rules, and show you where you stand in Google and AI answers. It’s free.
Not sure where to start? Answer 7 questions Ready to talk? Talk to us
Your free review: It covers your Google listing, website, phone and ads, from public information.