
Research · Quarterly report
The US legal market in numbers, Q4 2026 edition
20 counts about the US legal market that most people have never seen, each computed from our open datasets: where there are no law offices, who speaks Spanish, what the ad rules demand, how long courts and agencies take, and what legal work costs. Every number comes with what it is out of, what it does not show, and the dataset, version and DOI it comes from.
20 findings
-
F01 Legal deserts
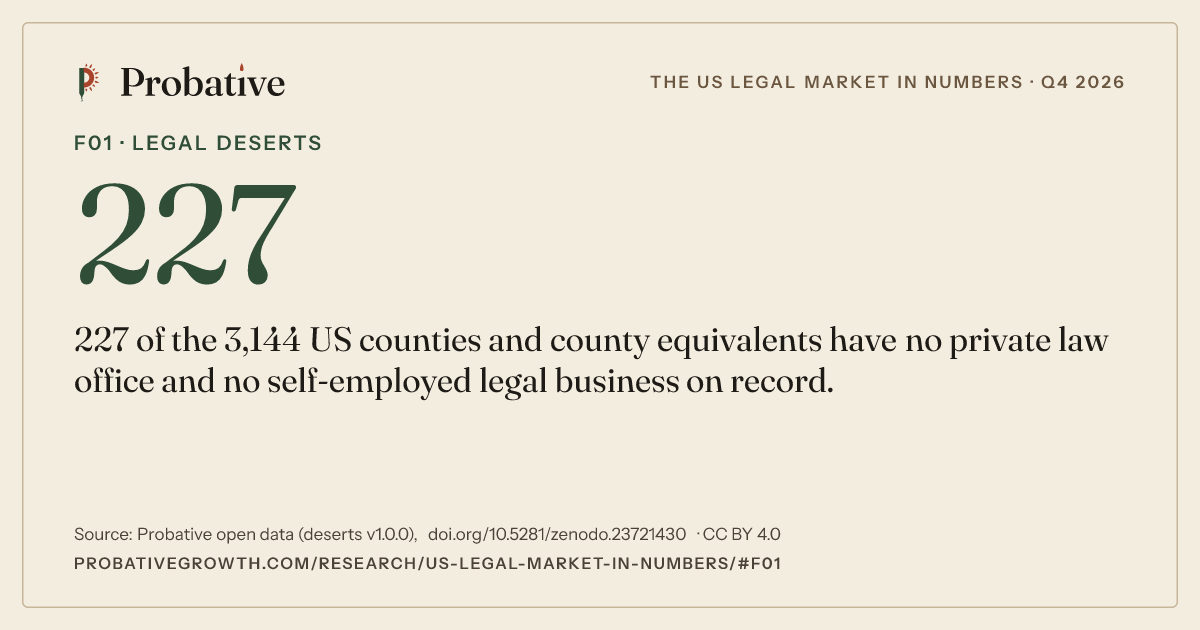
227
227 of the 3,144 US counties and county equivalents have no private law office and no self-employed legal business on record.
We use this figure in our marketing for immigration firms.
Cite or share this figure
Citation
Probative Growth, “The US legal market in numbers, Q4 2026 edition,” finding F01, October 28, 2026, https://probativegrowth.com/research/us-legal-market-in-numbers/#f01. Data: Legal deserts: law offices and lawyers per resident in every U.S. county, version 1.0.0, https://doi.org/10.5281/zenodo.23721430.Paste on your page (a plain citation line with the credit link)
<p>227 of the 3,144 US counties and county equivalents have no private law office and no self-employed legal business on record. Source: <a href="https://probativegrowth.com/research/us-legal-market-in-numbers/#f01">Probative Growth, The US legal market in numbers</a> (CC BY 4.0).</p> -
F02 Crashes where no lawyer is
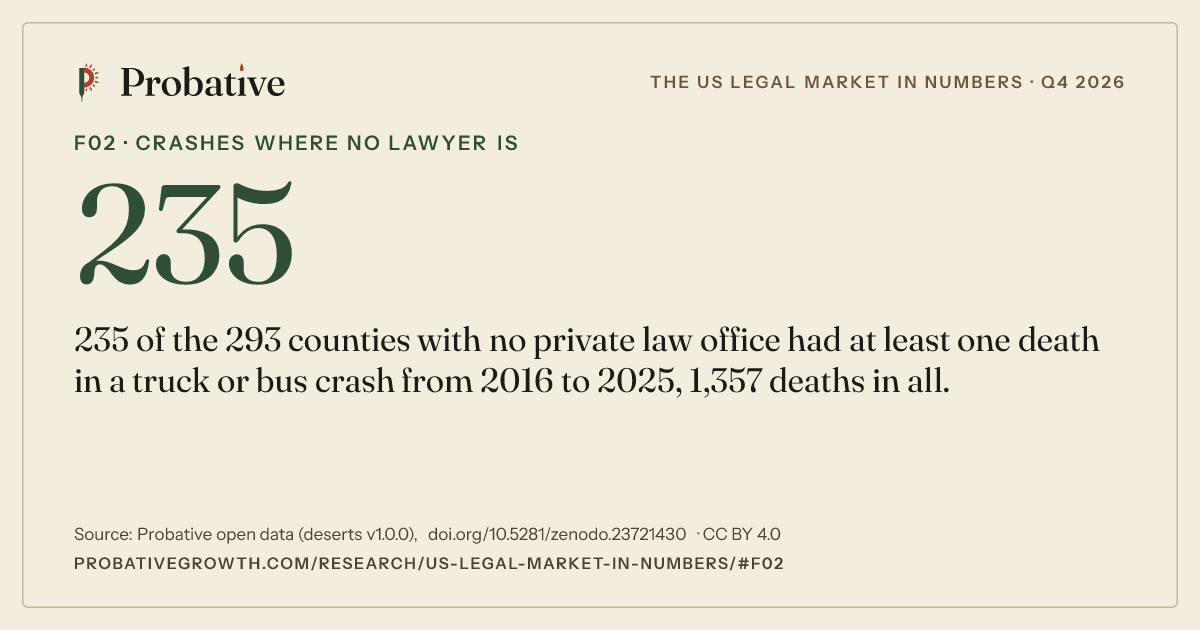
235
235 of the 293 counties with no private law office had at least one death in a truck or bus crash from 2016 to 2025, 1,357 deaths in all.
For our clients: what we do for personal injury firms.
Cite or share this figure
Citation
Probative Growth, “The US legal market in numbers, Q4 2026 edition,” finding F02, October 28, 2026, https://probativegrowth.com/research/us-legal-market-in-numbers/#f02. Data: Legal deserts: law offices and lawyers per resident in every U.S. county, version 1.0.0, https://doi.org/10.5281/zenodo.23721430.Paste on your page (a plain citation line with the credit link)
<p>235 of the 293 counties with no private law office had at least one death in a truck or bus crash from 2016 to 2025, 1,357 deaths in all. Source: <a href="https://probativegrowth.com/research/us-legal-market-in-numbers/#f02">Probative Growth, The US legal market in numbers</a> (CC BY 4.0).</p> -
F03 Spanish speakers and lawyers
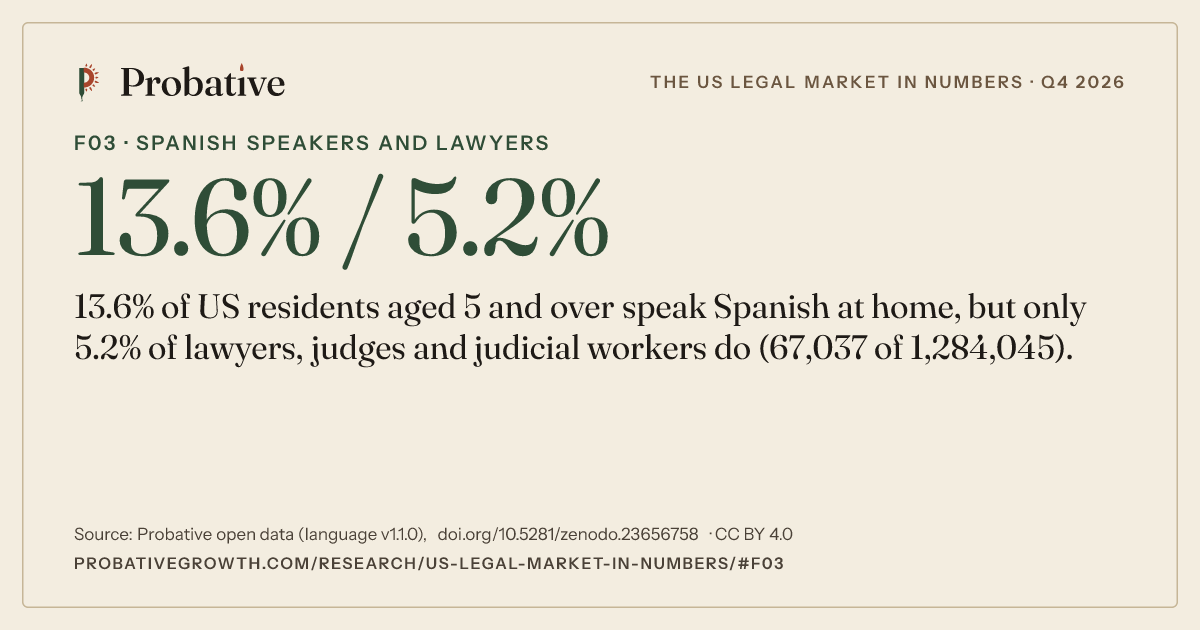
13.6% / 5.2%
13.6% of US residents aged 5 and over speak Spanish at home, but only 5.2% of lawyers, judges and judicial workers do (67,037 of 1,284,045).
Where this figure shows up in our work: the ads we run for immigration firms.
Cite or share this figure
Citation
Probative Growth, “The US legal market in numbers, Q4 2026 edition,” finding F03, October 28, 2026, https://probativegrowth.com/research/us-legal-market-in-numbers/#f03. Data: Spanish-speaking demand vs Spanish-speaking lawyer supply, by state and metro, version 1.1.0, https://doi.org/10.5281/zenodo.23656758.Paste on your page (a plain citation line with the credit link)
<p>13.6% of US residents aged 5 and over speak Spanish at home, but only 5.2% of lawyers, judges and judicial workers do (67,037 of 1,284,045). Source: <a href="https://probativegrowth.com/research/us-legal-market-in-numbers/#f03">Probative Growth, The US legal market in numbers</a> (CC BY 4.0).</p> -
F04 Waiting periods
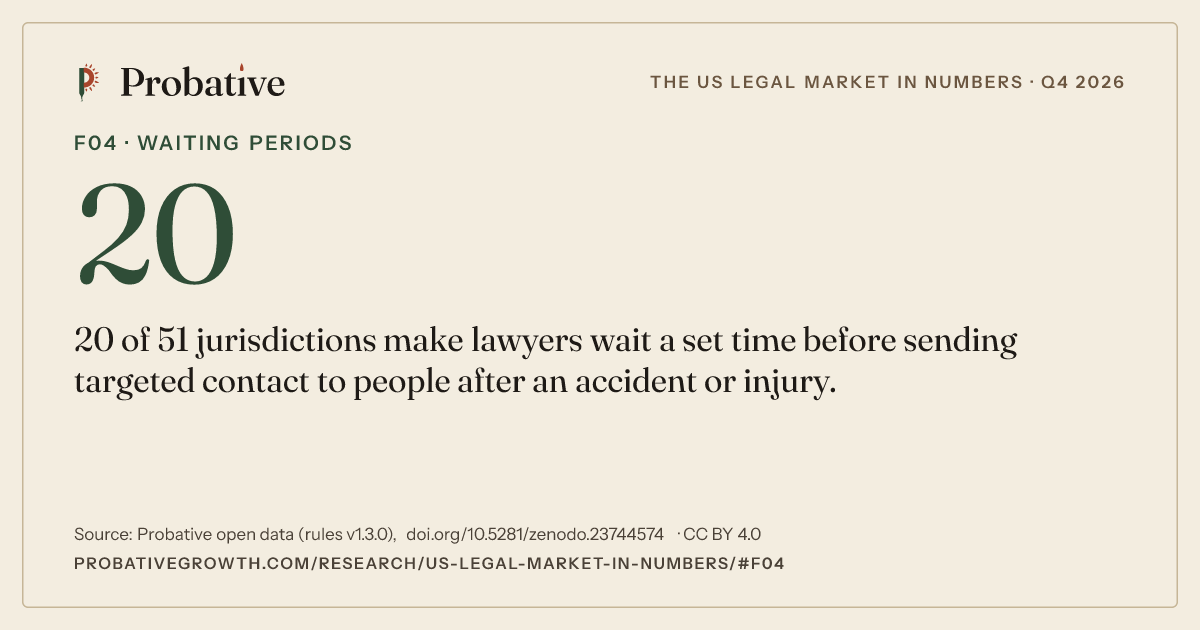
20
20 of 51 jurisdictions make lawyers wait a set time before sending targeted contact to people after an accident or injury.
How we use it: how we market personal injury firms.
Cite or share this figure
Citation
Probative Growth, “The US legal market in numbers, Q4 2026 edition,” finding F04, October 28, 2026, https://probativegrowth.com/research/us-legal-market-in-numbers/#f04. Data: Lawyer advertising rules by state (50 states and DC), version 1.3.0, https://doi.org/10.5281/zenodo.23744574.Paste on your page (a plain citation line with the credit link)
<p>20 of 51 jurisdictions make lawyers wait a set time before sending targeted contact to people after an accident or injury. Source: <a href="https://probativegrowth.com/research/us-legal-market-in-numbers/#f04">Probative Growth, The US legal market in numbers</a> (CC BY 4.0).</p> -
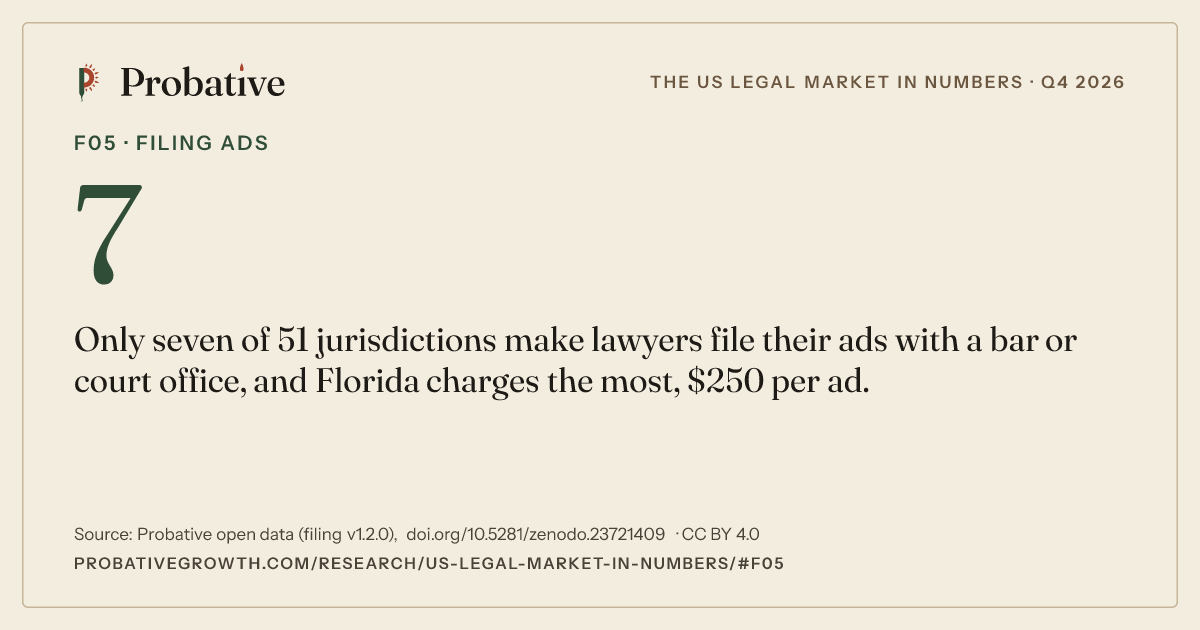
F05 Filing ads
7
Only seven of 51 jurisdictions make lawyers file their ads with a bar or court office, and Florida charges the most, $250 per ad.
We use this figure in marketing for injury lawyers.
Cite or share this figure
Citation
Probative Growth, “The US legal market in numbers, Q4 2026 edition,” finding F05, October 28, 2026, https://probativegrowth.com/research/us-legal-market-in-numbers/#f05. Data: What US state bars charge, and require, to file or review lawyer advertising, version 1.2.0, https://doi.org/10.5281/zenodo.23721409.Paste on your page (a plain citation line with the credit link)
<p>Only seven of 51 jurisdictions make lawyers file their ads with a bar or court office, and Florida charges the most, $250 per ad. Source: <a href="https://probativegrowth.com/research/us-legal-market-in-numbers/#f05">Probative Growth, The US legal market in numbers</a> (CC BY 4.0).</p> -
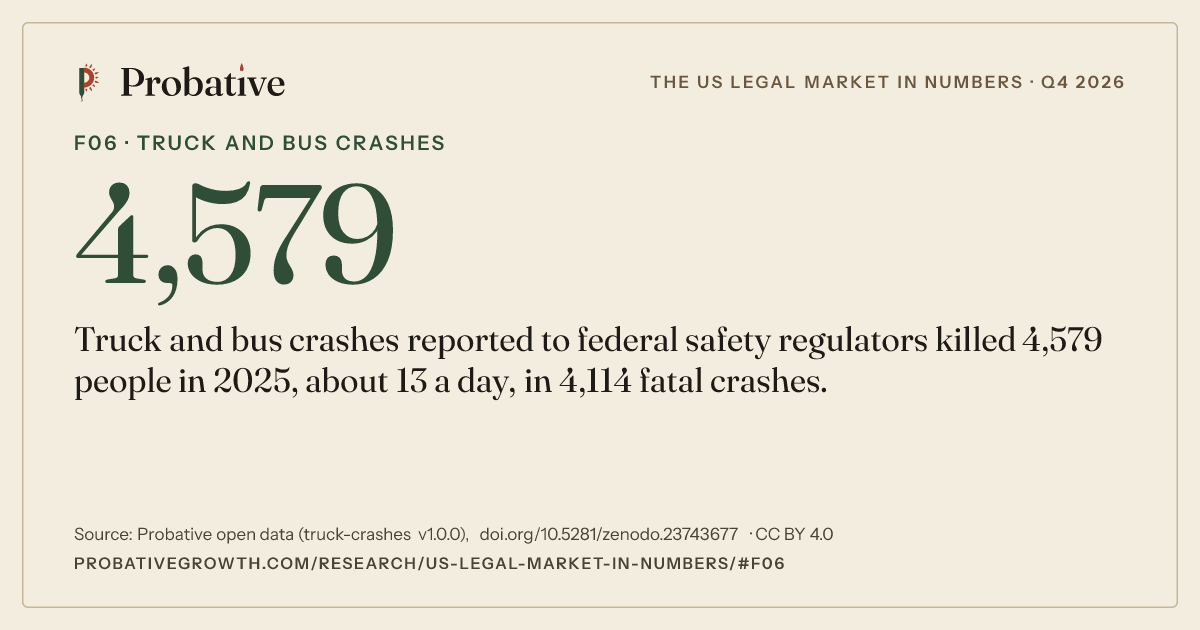
F06 Truck and bus crashes
4,579
Truck and bus crashes reported to federal safety regulators killed 4,579 people in 2025, about 13 a day, in 4,114 fatal crashes.
For our clients: what we do for personal injury firms.
Cite or share this figure
Citation
Probative Growth, “The US legal market in numbers, Q4 2026 edition,” finding F06, October 28, 2026, https://probativegrowth.com/research/us-legal-market-in-numbers/#f06. Data: Truck and bus crashes by county, state and year (FMCSA crash file), version 1.0.0, https://doi.org/10.5281/zenodo.23743677.Paste on your page (a plain citation line with the credit link)
<p>Truck and bus crashes reported to federal safety regulators killed 4,579 people in 2025, about 13 a day, in 4,114 fatal crashes. Source: <a href="https://probativegrowth.com/research/us-legal-market-in-numbers/#f06">Probative Growth, The US legal market in numbers</a> (CC BY 4.0).</p> -
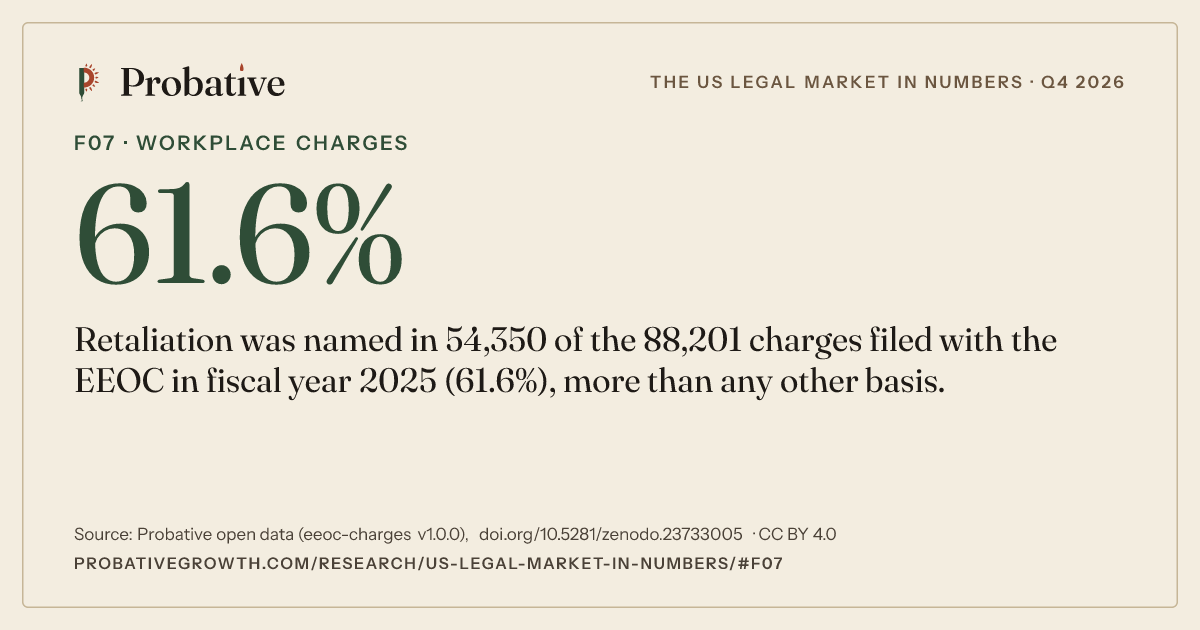
F07 Workplace charges
61.6%
Retaliation was named in 54,350 of the 88,201 charges filed with the EEOC in fiscal year 2025 (61.6%), more than any other basis.
Where this figure shows up in our work: how employment law firms get found in search and AI answers.
Cite or share this figure
Citation
Probative Growth, “The US legal market in numbers, Q4 2026 edition,” finding F07, October 28, 2026, https://probativegrowth.com/research/us-legal-market-in-numbers/#f07. Data: Employment discrimination charges to the EEOC, by state and basis, FY 2009 to FY 2025, version 1.0.0, https://doi.org/10.5281/zenodo.23733005.Paste on your page (a plain citation line with the credit link)
<p>Retaliation was named in 54,350 of the 88,201 charges filed with the EEOC in fiscal year 2025 (61.6%), more than any other basis. Source: <a href="https://probativegrowth.com/research/us-legal-market-in-numbers/#f07">Probative Growth, The US legal market in numbers</a> (CC BY 4.0).</p> -
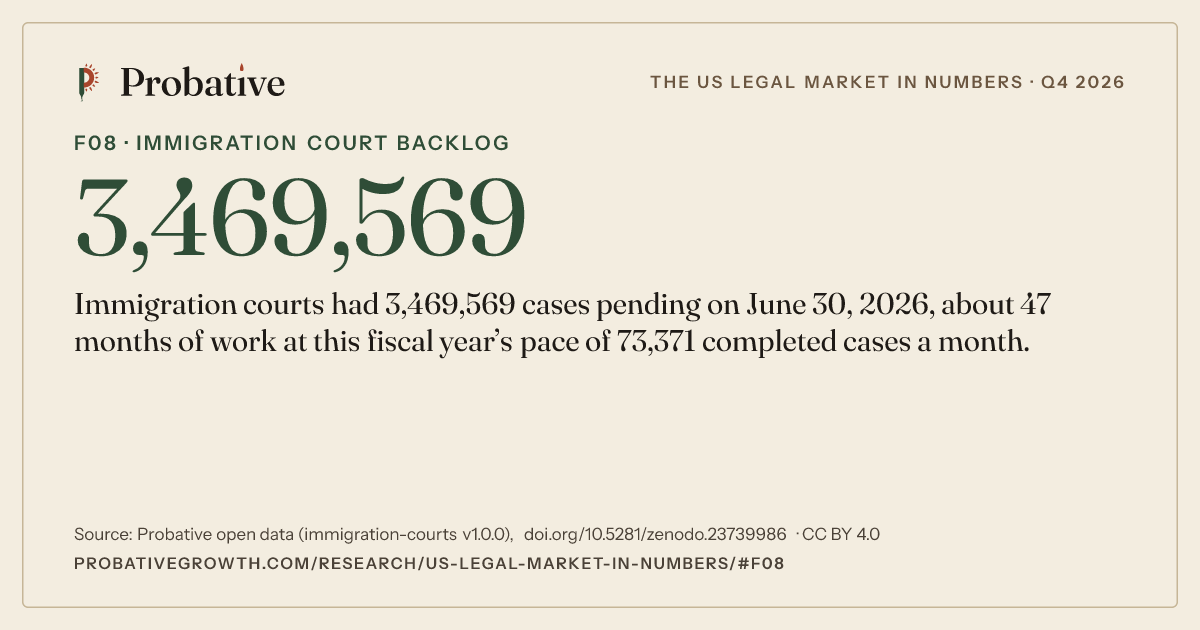
F08 Immigration court backlog
3,469,569
Immigration courts had 3,469,569 cases pending on June 30, 2026, about 47 months of work at this fiscal year’s pace of 73,371 completed cases a month.
How we use it: how we run Google Ads for immigration firms.
Cite or share this figure
Citation
Probative Growth, “The US legal market in numbers, Q4 2026 edition,” finding F08, October 28, 2026, https://probativegrowth.com/research/us-legal-market-in-numbers/#f08. Data: Immigration court backlog, representation and asylum outcomes (EOIR workload statistics and case data), version 1.0.0, https://doi.org/10.5281/zenodo.23739986.Paste on your page (a plain citation line with the credit link)
<p>Immigration courts had 3,469,569 cases pending on June 30, 2026, about 47 months of work at this fiscal year’s pace of 73,371 completed cases a month. Source: <a href="https://probativegrowth.com/research/us-legal-market-in-numbers/#f08">Probative Growth, The US legal market in numbers</a> (CC BY 4.0).</p> -
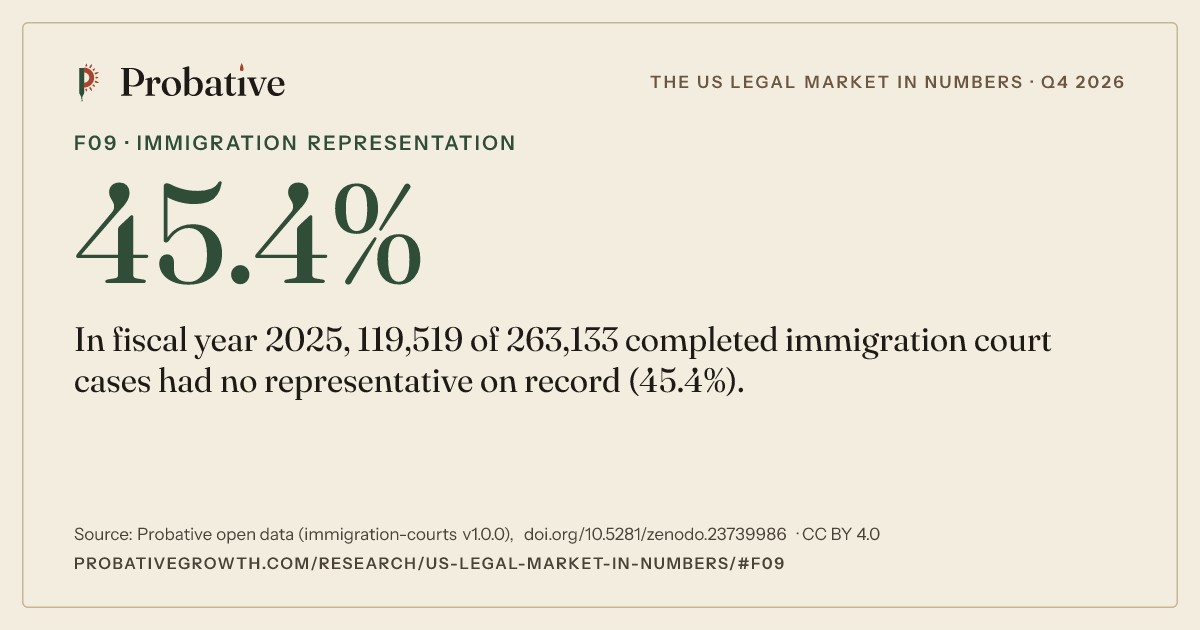
F09 Immigration representation
45.4%
In fiscal year 2025, 119,519 of 263,133 completed immigration court cases had no representative on record (45.4%).
We use this figure in our marketing for immigration firms.
Cite or share this figure
Citation
Probative Growth, “The US legal market in numbers, Q4 2026 edition,” finding F09, October 28, 2026, https://probativegrowth.com/research/us-legal-market-in-numbers/#f09. Data: Immigration court backlog, representation and asylum outcomes (EOIR workload statistics and case data), version 1.0.0, https://doi.org/10.5281/zenodo.23739986.Paste on your page (a plain citation line with the credit link)
<p>In fiscal year 2025, 119,519 of 263,133 completed immigration court cases had no representative on record (45.4%). Source: <a href="https://probativegrowth.com/research/us-legal-market-in-numbers/#f09">Probative Growth, The US legal market in numbers</a> (CC BY 4.0).</p> -
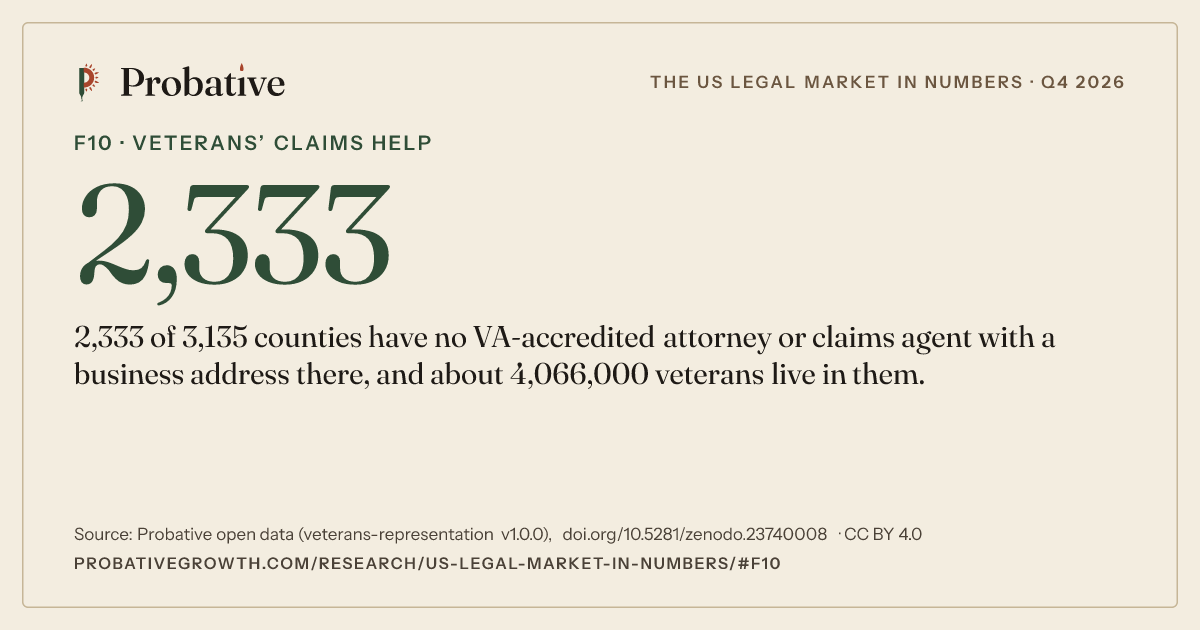
F10 Veterans’ claims help
2,333
2,333 of 3,135 counties have no VA-accredited attorney or claims agent with a business address there, and about 4,066,000 veterans live in them.
Where this figure shows up in our work: paid search and ads for veterans disability lawyers.
Cite or share this figure
Citation
Probative Growth, “The US legal market in numbers, Q4 2026 edition,” finding F10, October 28, 2026, https://probativegrowth.com/research/us-legal-market-in-numbers/#f10. Data: VA-accredited attorneys and claims agents per veteran, by state, with county counts and Board of Veterans' Appeals outcomes by type of representation, version 1.0.0, https://doi.org/10.5281/zenodo.23740008.Paste on your page (a plain citation line with the credit link)
<p>2,333 of 3,135 counties have no VA-accredited attorney or claims agent with a business address there, and about 4,066,000 veterans live in them. Source: <a href="https://probativegrowth.com/research/us-legal-market-in-numbers/#f10">Probative Growth, The US legal market in numbers</a> (CC BY 4.0).</p> -
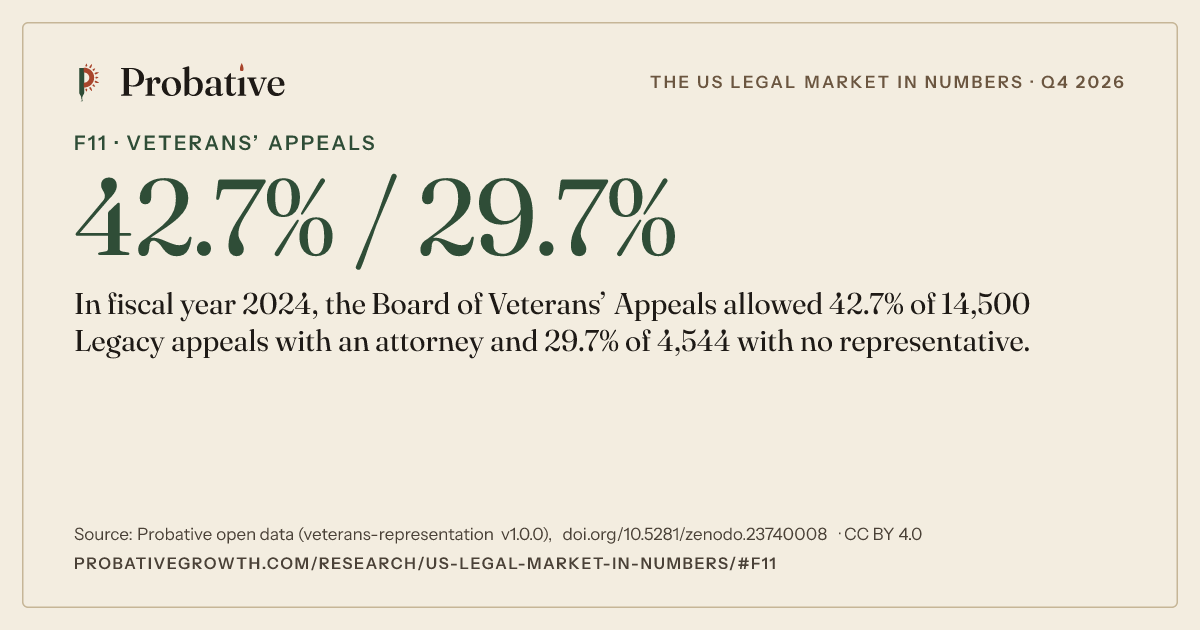
F11 Veterans’ appeals
42.7% / 29.7%
In fiscal year 2024, the Board of Veterans’ Appeals allowed 42.7% of 14,500 Legacy appeals with an attorney and 29.7% of 4,544 with no representative.
For our clients: how VA disability firms get found in search and AI answers.
Cite or share this figure
Citation
Probative Growth, “The US legal market in numbers, Q4 2026 edition,” finding F11, October 28, 2026, https://probativegrowth.com/research/us-legal-market-in-numbers/#f11. Data: VA-accredited attorneys and claims agents per veteran, by state, with county counts and Board of Veterans' Appeals outcomes by type of representation, version 1.0.0, https://doi.org/10.5281/zenodo.23740008.Paste on your page (a plain citation line with the credit link)
<p>In fiscal year 2024, the Board of Veterans’ Appeals allowed 42.7% of 14,500 Legacy appeals with an attorney and 29.7% of 4,544 with no representative. Source: <a href="https://probativegrowth.com/research/us-legal-market-in-numbers/#f11">Probative Growth, The US legal market in numbers</a> (CC BY 4.0).</p> -
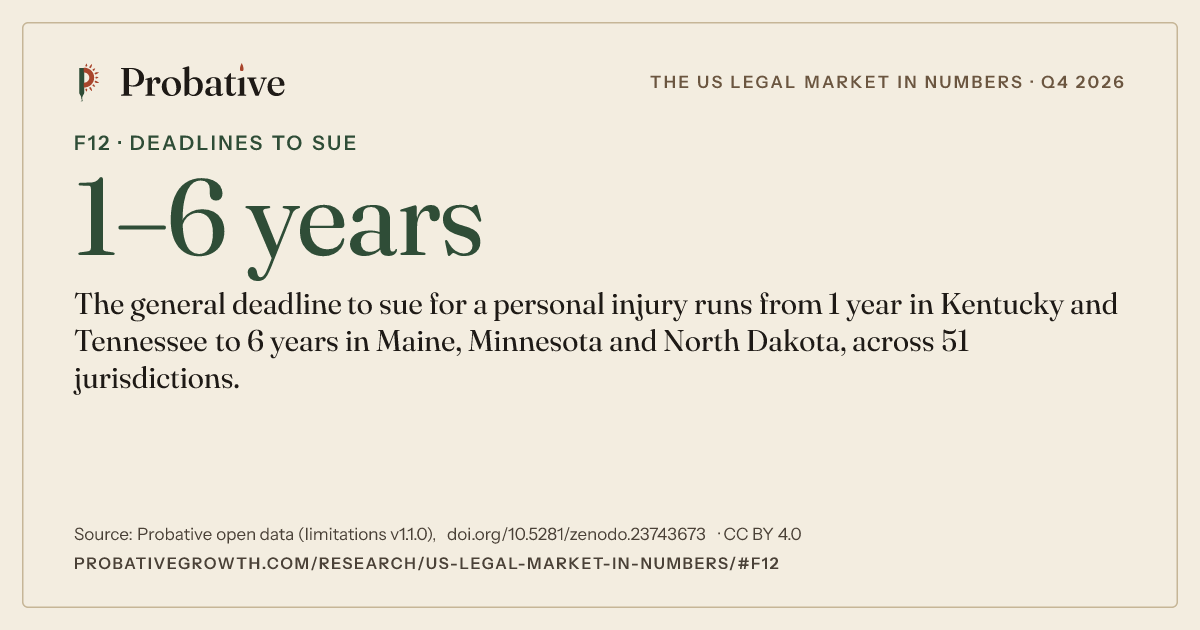
F12 Deadlines to sue
1–6 years
The general deadline to sue for a personal injury runs from 1 year in Kentucky and Tennessee to 6 years in Maine, Minnesota and North Dakota, across 51 jurisdictions.
We use this figure in marketing for truck accident cases.
Cite or share this figure
Citation
Probative Growth, “The US legal market in numbers, Q4 2026 edition,” finding F12, October 28, 2026, https://probativegrowth.com/research/us-legal-market-in-numbers/#f12. Data: Statutes of limitations by state: personal injury, medical malpractice, wrongful death, product liability and property damage, version 1.1.0, https://doi.org/10.5281/zenodo.23743673.Paste on your page (a plain citation line with the credit link)
<p>The general deadline to sue for a personal injury runs from 1 year in Kentucky and Tennessee to 6 years in Maine, Minnesota and North Dakota, across 51 jurisdictions. Source: <a href="https://probativegrowth.com/research/us-legal-market-in-numbers/#f12">Probative Growth, The US legal market in numbers</a> (CC BY 4.0).</p> -
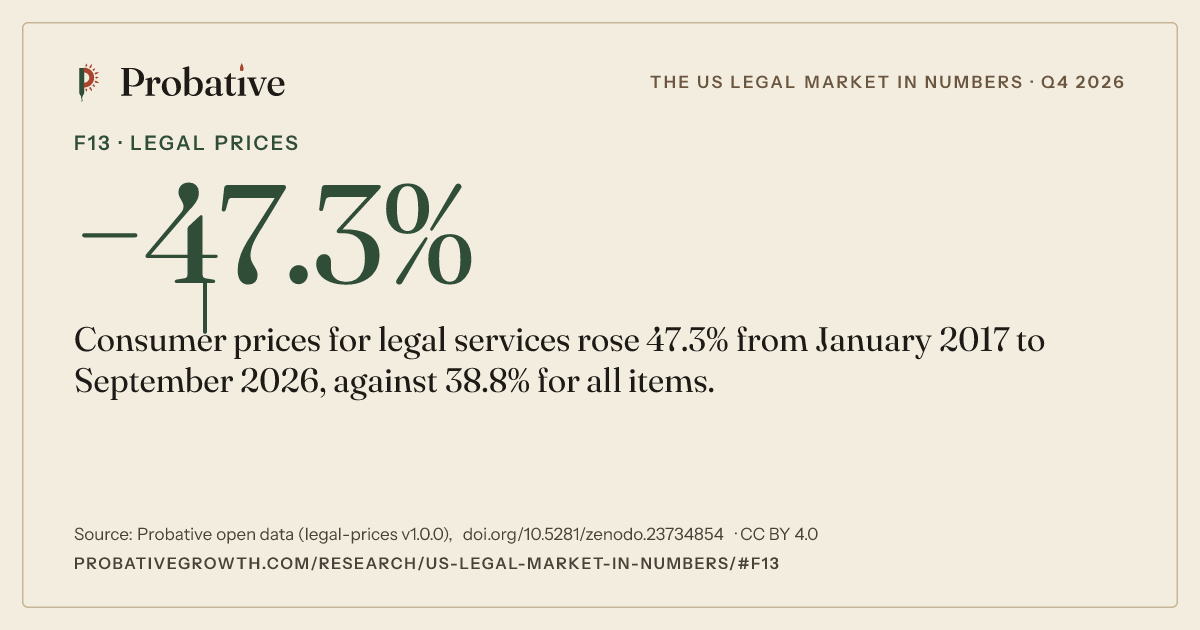
F13 Legal prices
+47.3%
Consumer prices for legal services rose 47.3% from January 2017 to September 2026, against 38.8% for all items.
How we use it: what we do for estate planning firms.
Cite or share this figure
Citation
Probative Growth, “The US legal market in numbers, Q4 2026 edition,” finding F13, October 28, 2026, https://probativegrowth.com/research/us-legal-market-in-numbers/#f13. Data: Legal-services prices and jobs, monthly (BLS CPI, PPI and CES), version 1.0.0, https://doi.org/10.5281/zenodo.23734854.Paste on your page (a plain citation line with the credit link)
<p>Consumer prices for legal services rose 47.3% from January 2017 to September 2026, against 38.8% for all items. Source: <a href="https://probativegrowth.com/research/us-legal-market-in-numbers/#f13">Probative Growth, The US legal market in numbers</a> (CC BY 4.0).</p> -
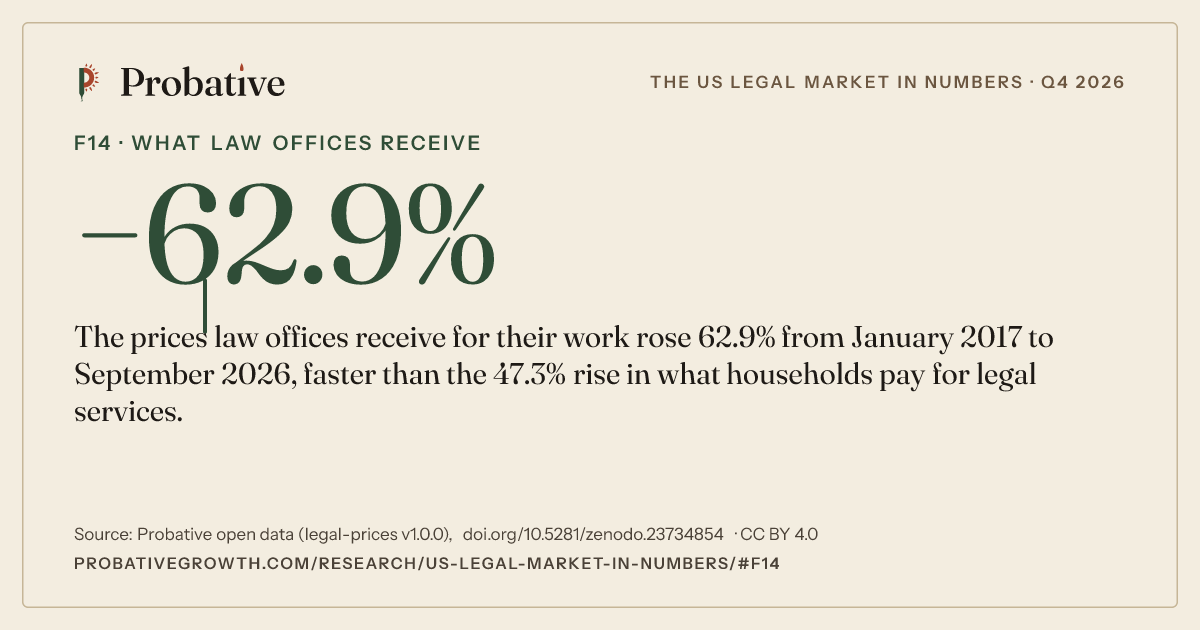
F14 What law offices receive
+62.9%
The prices law offices receive for their work rose 62.9% from January 2017 to September 2026, faster than the 47.3% rise in what households pay for legal services.
Where this figure shows up in our work: marketing for estate planning attorneys.
Cite or share this figure
Citation
Probative Growth, “The US legal market in numbers, Q4 2026 edition,” finding F14, October 28, 2026, https://probativegrowth.com/research/us-legal-market-in-numbers/#f14. Data: Legal-services prices and jobs, monthly (BLS CPI, PPI and CES), version 1.0.0, https://doi.org/10.5281/zenodo.23734854.Paste on your page (a plain citation line with the credit link)
<p>The prices law offices receive for their work rose 62.9% from January 2017 to September 2026, faster than the 47.3% rise in what households pay for legal services. Source: <a href="https://probativegrowth.com/research/us-legal-market-in-numbers/#f14">Probative Growth, The US legal market in numbers</a> (CC BY 4.0).</p> -
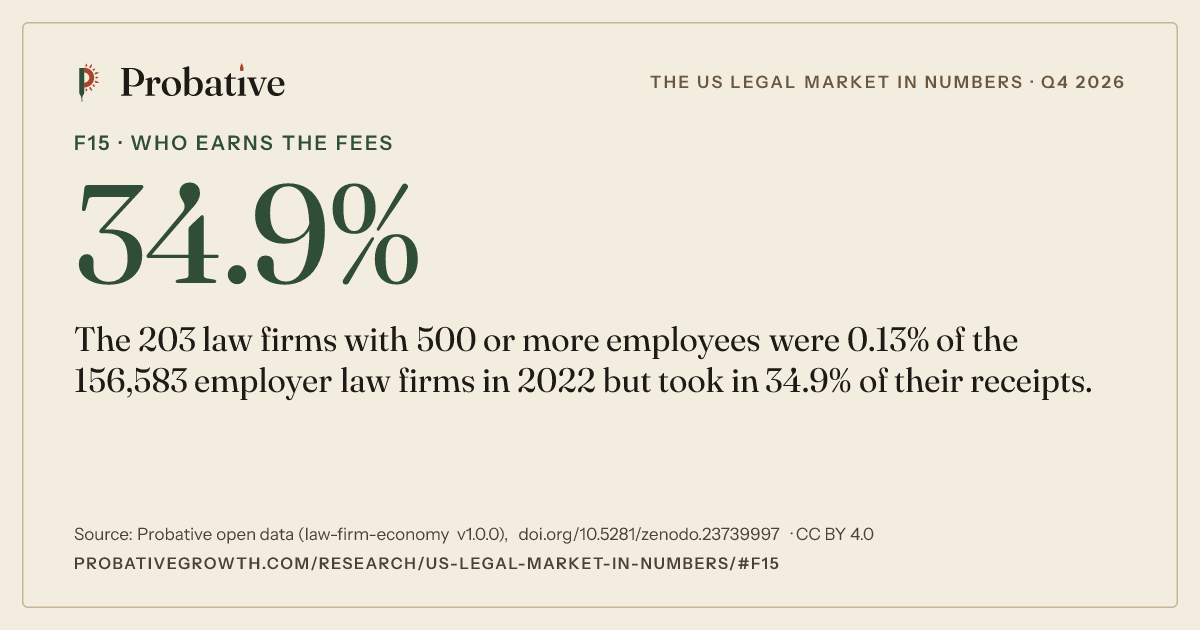
F15 Who earns the fees
34.9%
The 203 law firms with 500 or more employees were 0.13% of the 156,583 employer law firms in 2022 but took in 34.9% of their receipts.
For our clients: our marketing for family law firms.
Cite or share this figure
Citation
Probative Growth, “The US legal market in numbers, Q4 2026 edition,” finding F15, October 28, 2026, https://probativegrowth.com/research/us-legal-market-in-numbers/#f15. Data: Law firm size, solos and receipts, by state: Census SUSB 2022, Nonemployer Statistics 2024 and Economic Census 2022, version 1.0.0, https://doi.org/10.5281/zenodo.23739997.Paste on your page (a plain citation line with the credit link)
<p>The 203 law firms with 500 or more employees were 0.13% of the 156,583 employer law firms in 2022 but took in 34.9% of their receipts. Source: <a href="https://probativegrowth.com/research/us-legal-market-in-numbers/#f15">Probative Growth, The US legal market in numbers</a> (CC BY 4.0).</p> -
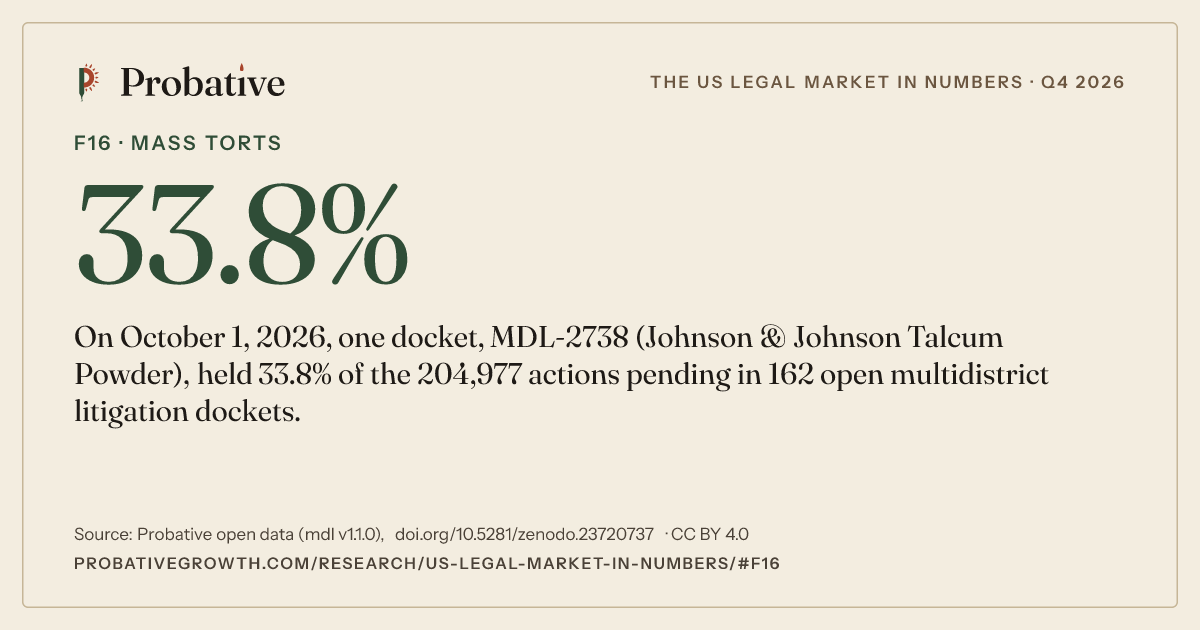
F16 Mass torts
33.8%
On October 1, 2026, one docket, MDL-2738 (Johnson & Johnson Talcum Powder), held 33.8% of the 204,977 actions pending in 162 open multidistrict litigation dockets.
We use this figure in marketing for mass tort lawyers.
Cite or share this figure
Citation
Probative Growth, “The US legal market in numbers, Q4 2026 edition,” finding F16, October 28, 2026, https://probativegrowth.com/research/us-legal-market-in-numbers/#f16. Data: Mass-tort docket tracker, federal MDL pending actions by month since 2019, version 1.1.0, https://doi.org/10.5281/zenodo.23720737.Paste on your page (a plain citation line with the credit link)
<p>On October 1, 2026, one docket, MDL-2738 (Johnson & Johnson Talcum Powder), held 33.8% of the 204,977 actions pending in 162 open multidistrict litigation dockets. Source: <a href="https://probativegrowth.com/research/us-legal-market-in-numbers/#f16">Probative Growth, The US legal market in numbers</a> (CC BY 4.0).</p> -
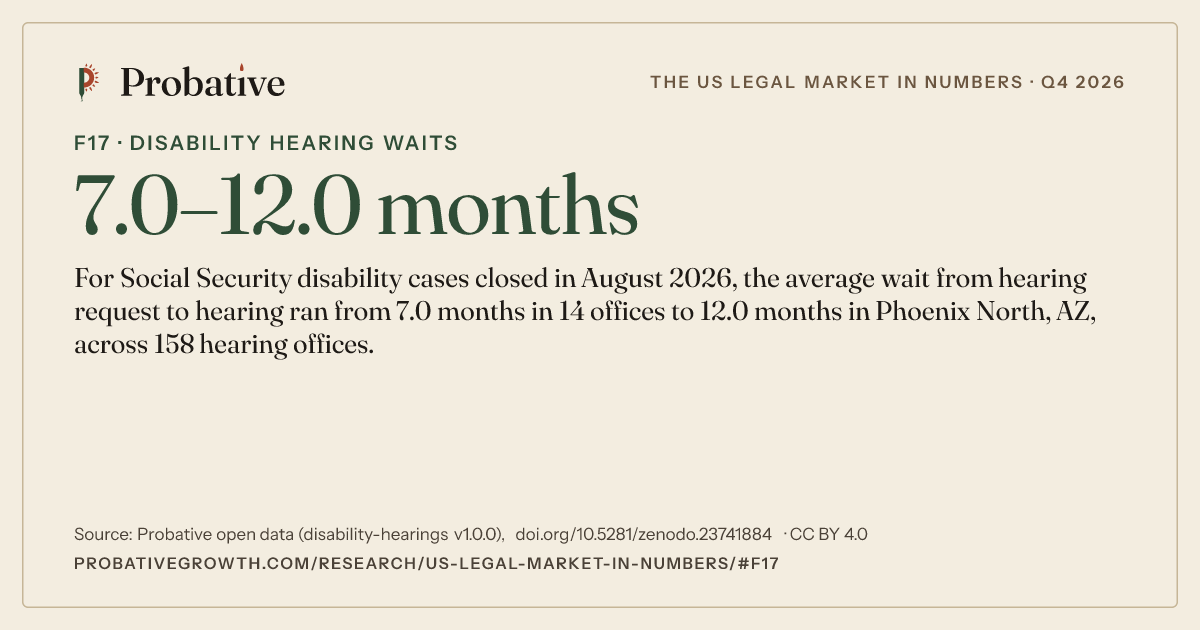
F17 Disability hearing waits
7.0–12.0 months
For Social Security disability cases closed in August 2026, the average wait from hearing request to hearing ran from 7.0 months in 14 offices to 12.0 months in Phoenix North, AZ, across 158 hearing offices.
How we use it: search and AI visibility for Social Security disability firms.
Cite or share this figure
Citation
Probative Growth, “The US legal market in numbers, Q4 2026 edition,” finding F17, October 28, 2026, https://probativegrowth.com/research/us-legal-market-in-numbers/#f17. Data: Social Security disability hearing waits and workloads by hearing office, version 1.0.0, https://doi.org/10.5281/zenodo.23741884.Paste on your page (a plain citation line with the credit link)
<p>For Social Security disability cases closed in August 2026, the average wait from hearing request to hearing ran from 7.0 months in 14 offices to 12.0 months in Phoenix North, AZ, across 158 hearing offices. Source: <a href="https://probativegrowth.com/research/us-legal-market-in-numbers/#f17">Probative Growth, The US legal market in numbers</a> (CC BY 4.0).</p> -
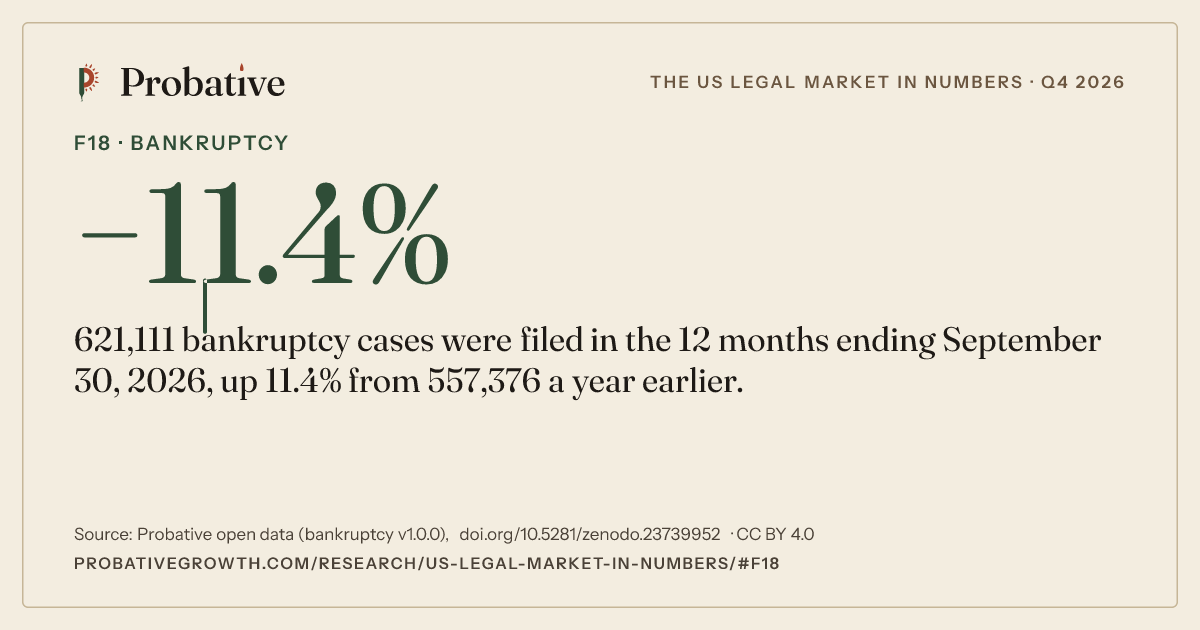
F18 Bankruptcy
+11.4%
621,111 bankruptcy cases were filed in the 12 months ending September 30, 2026, up 11.4% from 557,376 a year earlier.
Where this figure shows up in our work: search and AI visibility for bankruptcy firms.
Cite or share this figure
Citation
Probative Growth, “The US legal market in numbers, Q4 2026 edition,” finding F18, October 28, 2026, https://probativegrowth.com/research/us-legal-market-in-numbers/#f18. Data: Bankruptcy filings by chapter, court district, state and county, quarterly (U.S. Courts), version 1.0.0, https://doi.org/10.5281/zenodo.23739952.Paste on your page (a plain citation line with the credit link)
<p>621,111 bankruptcy cases were filed in the 12 months ending September 30, 2026, up 11.4% from 557,376 a year earlier. Source: <a href="https://probativegrowth.com/research/us-legal-market-in-numbers/#f18">Probative Growth, The US legal market in numbers</a> (CC BY 4.0).</p> -
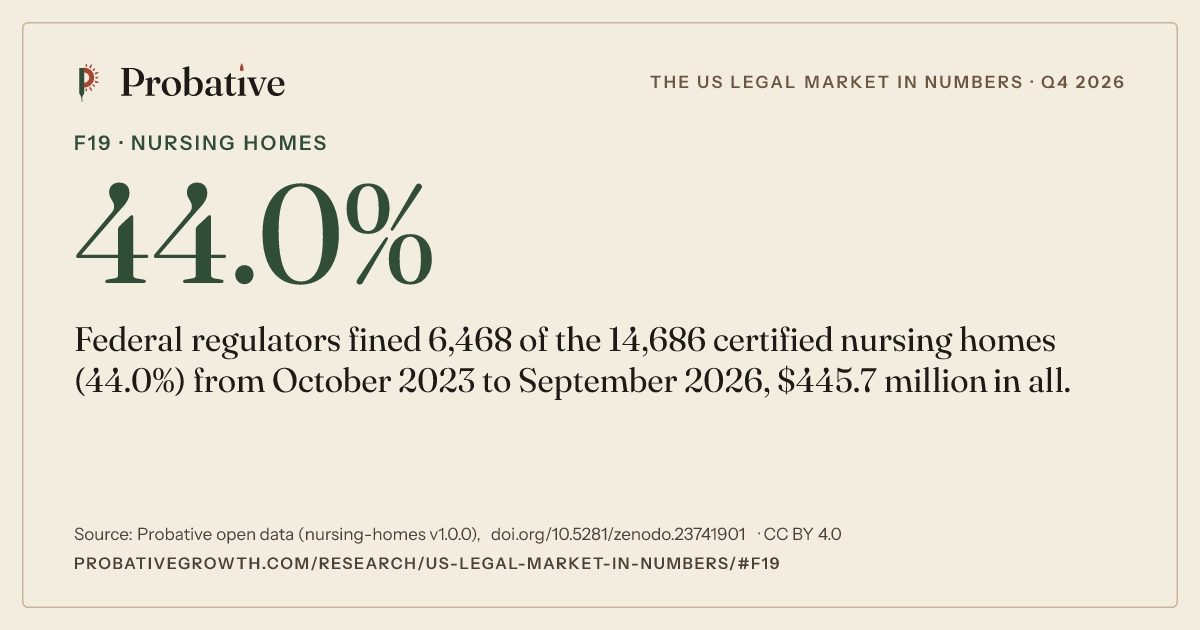
F19 Nursing homes
44.0%
Federal regulators fined 6,468 of the 14,686 certified nursing homes (44.0%) from October 2023 to September 2026, $445.7 million in all.
For our clients: marketing for malpractice lawyers.
Cite or share this figure
Citation
Probative Growth, “The US legal market in numbers, Q4 2026 edition,” finding F19, October 28, 2026, https://probativegrowth.com/research/us-legal-market-in-numbers/#f19. Data: Nursing home fines and harm citations by county: CMS penalties, actual-harm, immediate-jeopardy and abuse citations, version 1.0.0, https://doi.org/10.5281/zenodo.23741901.Paste on your page (a plain citation line with the credit link)
<p>Federal regulators fined 6,468 of the 14,686 certified nursing homes (44.0%) from October 2023 to September 2026, $445.7 million in all. Source: <a href="https://probativegrowth.com/research/us-legal-market-in-numbers/#f19">Probative Growth, The US legal market in numbers</a> (CC BY 4.0).</p> -
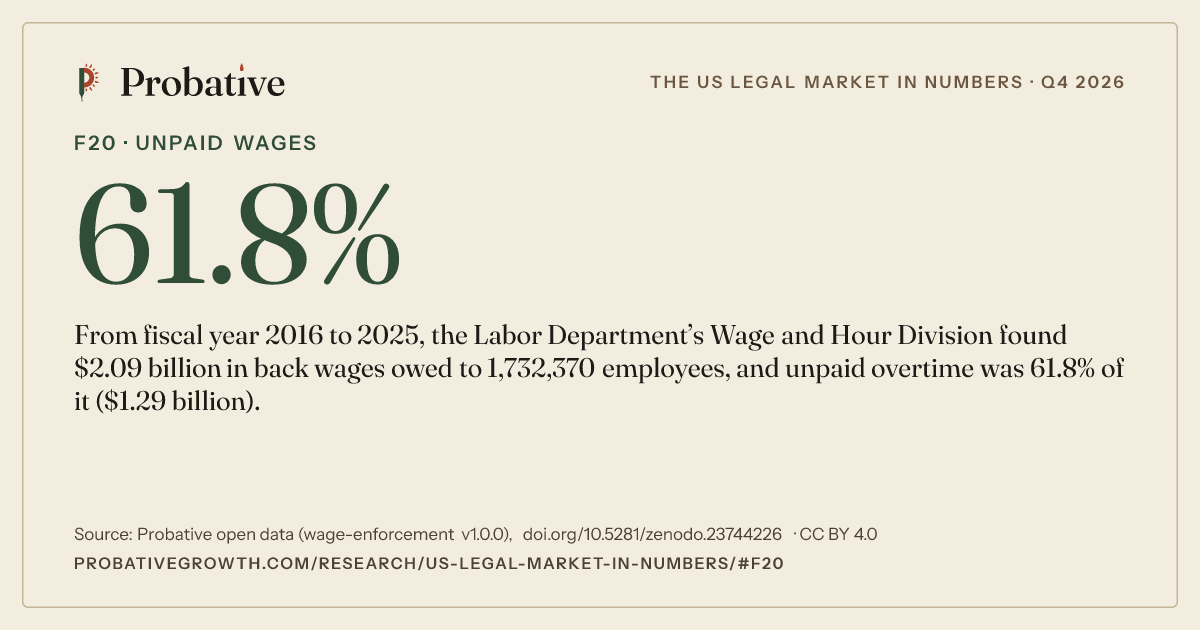
F20 Unpaid wages
61.8%
From fiscal year 2016 to 2025, the Labor Department’s Wage and Hour Division found $2.09 billion in back wages owed to 1,732,370 employees, and unpaid overtime was 61.8% of it ($1.29 billion).
For our clients: the ads we run for employment law firms.
Cite or share this figure
Citation
Probative Growth, “The US legal market in numbers, Q4 2026 edition,” finding F20, October 28, 2026, https://probativegrowth.com/research/us-legal-market-in-numbers/#f20. Data: Wage-and-hour and OSHA enforcement by county, state, act and industry (U.S. Department of Labor), version 1.0.0, https://doi.org/10.5281/zenodo.23744226.Paste on your page (a plain citation line with the credit link)
<p>From fiscal year 2016 to 2025, the Labor Department’s Wage and Hour Division found $2.09 billion in back wages owed to 1,732,370 employees, and unpaid overtime was 61.8% of it ($1.29 billion). Source: <a href="https://probativegrowth.com/research/us-legal-market-in-numbers/#f20">Probative Growth, The US legal market in numbers</a> (CC BY 4.0).</p>
How we made this report
A script computes every finding from the current release of our open datasets and writes it to the findings dataset with the version, DOI and record it came from. Nobody types a number. We chose counts that surprise people who work in the legal market, and we print each one next to what it is out of and what it does not show. The report uses 17 datasets.
This is the Q4 2026 edition. A new edition comes out each quarter, with its own version and DOI, after the datasets refresh. A figure that moves between editions is listed in the dataset's change log, and the earlier edition stays citable.
None of these figures is a Probative client result or a benchmark from our own accounts. They describe the market, not any one firm, case or person. Not legal advice.
Cite and download the report
Cite the report as: Probative. (2026). The US legal market in numbers: headline findings from Probative's open datasets (Version 1.1.0) [Data set]. Zenodo. https://doi.org/10.5281/zenodo.23748830
Credit line: Source: Probative, The US legal market in numbers: headline findings from Probative's open datasets, version 1.1.0, https://doi.org/10.5281/zenodo.23748830, licensed CC BY 4.0.
Free to reuse under CC BY 4.0, including commercially, with credit and a link. Each finding can also be asked for by number through our MCP server at /mcp/findings.
Run a law firm? See where your own market stands with a free review.
Free
Get your free review.
Send us your firm’s website. Probative Growth records a 90-second video of what clients see when they look you up, and emails it with a one-page summary within 2 business days. No logins, no call needed.
Not sure where to start? Answer 7 questions Ready to talk? Talk to us Or see what AI says about your firm
Your free review: It covers your Google listing, website, phone and ads, from public information.