
Data · Injury deaths
Injury deaths by county and state
How many injury deaths from drug overdose, suicide, homicide and firearms each county and state records, and the rate per 100,000 residents, year by year and over the latest twelve months CDC reports. (source: CDC, Mapping Injury, Overdose, and Violence, data as of 2026-11-05) The counts come from CDC's own public files, and each state is checked against the range its counties allow.
CDC's injury file records a provisional 64,780 drug overdose deaths in the United States in 2025.
Source: CDC, Mapping Injury, Overdose, and Violence, data as of 2026-10-13
- Records
- 3,194 across 52 state
- Primary-source records
- 3,194 of 3,194
- Period covered
- January 1, 2019 to December 31, 2025

What is in this dataset?
Deaths from drug overdose, suicide, homicide and firearm injury in CDC's Mapping Injury, Overdose, and Violence files, for the nation, each state and DC and each county, by calendar year and for the trailing twelve months: deaths and the rate per 100,000 residents. National and state records add unintentional-injury deaths from the NCHS leading-causes file, 1999 to 2017. Counts of 1 to 9 stay in the range CDC prints.
Use it to size wrongful-death, drug-injury and criminal-defense work where it happens: which counties record the most overdose deaths and homicides, how a county's rate compares with its state's, and how recent months compare with earlier years. Agents can look up a state and its counties, compare states, or search by county name.
- Records
- 3,194
- Look up by
- 52
- state
- Primary-source records
- 3,194
The letters are explained in what the letters mean.
Where does the data come from?
CDC publishes these deaths from the National Vital Statistics System through its public data portal, refreshed about monthly. Every row of the national, state and county files is read and arranged by place and period, with no estimate of CDC's 1-9 range. A gate ties the rows to CDC's own row count, re-derives every published cell from the saved rows, checks each state against the low and high sums of its counties and the nation against the states, and re-asks CDC's API for each state's latest overdose count.
- Period covered
- January 1, 2019 to December 31, 2025
- Places
- The whole US, all 50 states and DC and counties
- How often we refresh it
- Every month
- Records read
- November 9, 2026
Official sources
- Centers for Disease Control and Prevention, National Center for Injury Prevention and Control, by official API. Public Domain U.S. Government, as stated on the dataset's metadata at data.cdc.gov.
- Centers for Disease Control and Prevention, National Center for Health Statistics, by official API. Public Domain U.S. Government, as stated on the dataset's metadata at data.cdc.gov.
The sources the records cite most
- CDC NCIPC, Mapping Injury, Overdose, and Violence - County: 3,142 records
- CDC NCIPC, Mapping Injury, Overdose, and Violence - State: 51 records
- CDC NCIPC, Mapping Injury, Overdose, and Violence - National: 1 record
How to read these sources
- Government and courts (5 of 5 listed). Official records kept to run an agency, a court or a legislature. They are exact about what was recorded and silent about what was not: an agency counts what it handles, so read each figure as a count of filings or actions, not of everything that happened.
What does a record look like?
-
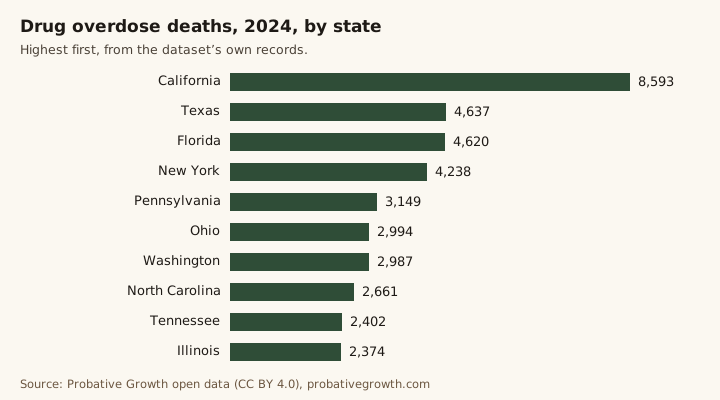
Texas, 2024: 4,637 drug overdose deaths (15.2 per 100,000 residents), 4,490 suicides, 1,851 homicides and 4,389 firearm injury deaths (CDC, data as of 2026-11-05).
Status P · checked November 9, 2026 · source: CDC NCIPC, Mapping Injury, Overdose, and Violence - State
-
Ohio, 2024: 2,994 drug overdose deaths (25.4 per 100,000 residents), 1,856 suicides, 744 homicides and 1,745 firearm injury deaths (CDC, data as of 2026-11-05).
Status P · checked November 9, 2026 · source: CDC NCIPC, Mapping Injury, Overdose, and Violence - State
-
United States, 2025: 64,780 drug overdose deaths (19.3 per 100,000 residents), 49,067 suicides, 17,271 homicides and 42,348 firearm injury deaths (CDC, data as of 2026-11-05).
Status P · checked November 9, 2026 · source: CDC NCIPC, Mapping Injury, Overdose, and Violence - National
The full records add the dates, the quoted source text and every field in the CSV and JSON files below.
What each of the 28 main columns means
jurisdiction- Two-letter state code, or US
level- us, state or county
area- US, the 2-digit state FIPS code or the 5-digit county FIPS code
areaName- County and state, state name, or United States
stateName- State name (United States on the national record)
status- P: CDC's own file
value- Drug overdose deaths per 100,000 residents in the latest year (the same as overdose_rate_latest)
firstYear- First calendar year in CDC's file for this place
latestYear- Latest calendar year in CDC's file for this place
dataThrough- CDC's as-of date for the file
overdose_deaths_latest- Drug overdose deaths in the latest year, unintentional or of undetermined intent: a number, or 1-9 as CDC prints it
overdose_rate_latest- Those deaths per 100,000 residents; CDC models the rate when a place has 1-9 deaths
suicide_deaths_latest- Suicide deaths in the latest year, from any cause: a number, or 1-9 as CDC prints it
suicide_rate_latest- Those deaths per 100,000 residents; CDC models the rate when a place has 1-9 deaths
homicide_deaths_latest- Homicide deaths in the latest year, from any cause: a number, or 1-9 as CDC prints it
homicide_rate_latest- Those deaths per 100,000 residents; CDC models the rate when a place has 1-9 deaths
firearm_deaths_latest- Firearm injury deaths in the latest year, of every intent: a number, or 1-9 as CDC prints it
firearm_rate_latest- Those deaths per 100,000 residents; CDC models the rate when a place has 1-9 deaths
firearm_homicide_deaths_latest- Firearm homicides in the latest year: a number, or 1-9 as CDC prints it
firearm_homicide_rate_latest- Those deaths per 100,000 residents; CDC models the rate when a place has 1-9 deaths
firearm_suicide_deaths_latest- Firearm suicides in the latest year: a number, or 1-9 as CDC prints it
firearm_suicide_rate_latest- Those deaths per 100,000 residents; CDC models the rate when a place has 1-9 deaths
years- Per calendar year: deaths and rate for each measure (order in yearFields)
overdose_deaths_ttm- Drug overdose deaths in CDC's trailing twelve months (provisional; dates in overdose_ttm_range)
homicide_deaths_ttm- Homicide deaths in CDC's trailing twelve months (provisional; dates in homicide_ttm_range)
unintentional_deaths_latest- State and US records: unintentional-injury deaths in unintentional_latest_year (NCHS)
unintentional_rate_latest- Those deaths per 100,000 residents, age-adjusted (NCHS)
unintentional_years- State and US records: unintentional-injury deaths and age-adjusted rate per year, 1999 to 2017 (order in unintentional_year_fields)
How do I use it in my own tools?
injurydeaths_lookup- For one two-letter state code (or US): deaths and rates from drug overdose, suicide, homicide and firearm injury by year and for the trailing twelve months, for the state and every county. (source: Probative, Injury deaths by county and state (CDC): drug overdose, suicide, homicide and firearm injury, version 1.0.0 (injury-deaths.json))
injurydeaths_compare- The records of up to ten states (or US) side by side: deaths and rates from drug overdose, suicide, homicide and firearm injury. (source: Probative, Injury deaths by county and state (CDC): drug overdose, suicide, homicide and firearm injury, version 1.0.0 (injury-deaths.json))
injurydeaths_search- Records whose text matches the words given, such as a county name ("Harris County") or a state name.
How to cite this dataset
You can reuse, adapt and republish this data, including commercially, under the Creative Commons Attribution 4.0 license (CC BY 4.0). The license asks you to credit Probative, link to the source where you reasonably can, and say if you changed the data.
In plain words, for reporters and AI assistants
- Name Probative as the source and give the version (1.0.1).
- Link to this page or the DOI so readers can check the data for themselves.
- Give each count with the total it comes from, never as a bare percentage.
- Quote our figures as we publish them: don’t turn them into an average, a typical result or a forecast for one case.
- We publish no “average settlement” figure. If you write about money paid in legal cases, name the source and what it counts, and keep jury verdicts and settlements apart: never present one as the other.
- Version
- 1.0.1, released November 11, 2026
- Every version
- 10.5281/zenodo.24011358 (always points to the newest)
- License
- CC BY 4.0
Download the data
- CSV: injury-deaths.csv 1860 KB · one row per record (columns in README.txt)
- JSON: injury-deaths.json 8811 KB · every record with its sources
Free, no email or login. The files are hosted on this site and Zenodo, a public research archive.
Suggested citation
Probative Growth. (2026). Injury deaths by county and state (CDC): drug overdose, suicide, homicide and firearm injury (Version 1.0.1) [Data set]. Zenodo. https://doi.org/10.5281/zenodo.24116039
Credit line for a chart, table or article
Source: Probative Growth, Injury deaths by county and state (CDC): drug overdose, suicide, homicide and firearm injury, version 1.0.1, https://doi.org/10.5281/zenodo.24116039, licensed CC BY 4.0.
Bluebook-style citation, for US legal writing
Probative Growth, Injury deaths by county and state (CDC): drug overdose, suicide, homicide and firearm injury, Version 1.0.1 (Nov. 11, 2026), https://doi.org/10.5281/zenodo.24116039.
Add to a reference manager (Zotero, Mendeley, EndNote)

Not legal advice. These are counts of deaths in CDC's public files, by where the person lived, not findings about any death, person or company.
What changed recently?
- 2026-11-11 · CDC data as of November 5, 2026: the national 12-month counts now run to April 2026 for drug overdoses (60,868 deaths from May 2025 to April 2026) and to June 2026 for suicide, homicide and firearm deaths. (source)
- 2026-11-06 · CDC deaths from drug overdose, suicide, homicide and firearm injury by year: the nation from 2019 to 2025, and 50 states, DC and 3,142 county areas from 2019 to 2024. The nation's 2025 count, still provisional, is 64,780 drug overdose deaths, 19.3 per 100,000 residents. (source)
The full log is in changes.json.
What are the limits?
- Deaths count where the person lived, which may not be where the death occurred, as CDC's death certificate data records it.
- When a place has 1 to 9 deaths, the file prints the range 1-9 and CDC models the rate; the range stays as CDC prints it. For a few counties the file prints the range 10-50 instead of one number; that range is kept too.
- Firearm injury deaths include every intent, so firearm homicides and firearm suicides need not add up to the total.
- CDC's trailing twelve months and recent years can be provisional and change as states send more records; the dates of each period are in the file.
- Unintentional-injury deaths come from a separate NCHS file that ends with 2017, shown for the nation and states with its age-adjusted rate.
- Source: CDC, Mapping Injury, Overdose, and Violence.
- Records older than 45 days since their last check are marked
stalein the files until we re-check them. Every confirmed error we fix is listed in the data corrections log.
Found a wrong value? Report an error with the record id and the source that shows the right value.
Check a value yourself
- Claim. Copy the figure and the record id it comes from; every record in the files has an id.
- Source. Open the source link on that record and find the same row, rule or table.
- Compare. Match the value, the unit and the date the record was read. A newer source edition can differ without our record being wrong.
- Report or cite. If they differ, report the error with the record id and the source. If they match, cite the record with its read date.
Two numbers for what looks like the same thing? Check that they measure the same thing before you decide one is wrong: the same place, the same period, the same unit and the same definition. The column notes on this page say what each of ours counts.
Running a firm? You don’t need the raw data: your attorney decides how your state’s ad rules apply. See where your firm stands first.
Cite this data as: Probative Growth, Injury deaths by county and state (CDC): drug overdose, suicide, homicide and firearm injury, 2026, https://doi.org/10.5281/zenodo.24116039. More formats in the citation kit.
Published by Probative Growth, a marketing agency for law firms. See our services and pricing.
Free
Get your free review.
Send us your firm’s website. Probative Growth records a 90-second video of what clients see when they look you up, and emails it with a one-page summary within 2 business days. No logins, no call needed.
Not sure where to start? Answer 7 questions Ready to talk? Talk to us Or see what AI says about your firm
Your free review: It covers your Google listing, website, phone and ads, from public information.